


Solana (SOLUSD) Suddenly Goes up 1.17% on Oct 10: What You Need to Watch
Solana (SOLUSD) is up 1.17% at Oct 10 01:40(ET), now at $109.3, with a 7-day down of 8.00%.
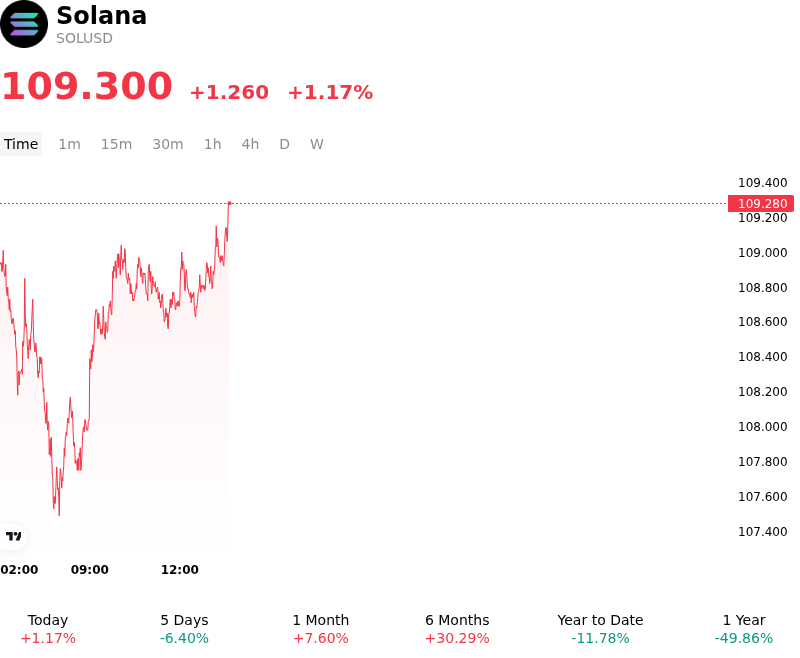
What is driving Solana (SOLUSD)’s stock price up today?
Solana's upward price trajectory was primarily catalyzed by the successful mainnet implementation of its 200-millisecond slot time target, marking the completion of a multi-stage protocol performance upgrade. This technical milestone halved original block production intervals, significantly reducing transaction finality times and improving network responsiveness for decentralized applications, high-frequency decentralized exchanges, and automated market makers. By demonstrating network stability while executing complex protocol enhancements, developer activity and operational throughput reinforced investor confidence in Solana’s long-term layer-one scaling roadmap. The resulting improvement in execution efficiency attracted active capital flows, positioning the network favorably relative to competing smart contract platforms.
Beyond protocol-level upgrades, institutional participation and enterprise adoption expectations provided sustained upward momentum. Institutional interest expanded following the release of open-source settlement frameworks tailored for institutional delivery-versus-payment transaction flows, combined with expanding enterprise wallet integrations for dollar-denominated stablecoin settlements. These developments bolstered institutional sentiment, encouraging net capital allocations into Solana-focused digital asset products and treasury reserves. Furthermore, growing decentralized finance total value locked and sustained high daily transaction volumes across the ecosystem reflected robust network utility, driving spot market demand as investors rotated capital into top-tier alternative layer-one assets.
The intraday price advance was further amplified by derivatives market positioning and liquidity dynamics. Following a period of broader market consolidation and elevated open interest in short positions around major technical support zones, the sudden upside push triggered a wave of short liquidations, driving forced buying across perpetual futures markets. While short-term risk sentiment improved, institutional investors continue to monitor macro headwinds, including global interest rate policy expectations, sovereign yield volatility, and potential validator operating cost shifts associated with tighter block propagation parameters. Nevertheless, the combination of protocol innovation, enterprise integration, and leverage clearing established a constructive environment for Solana’s immediate market structure.
Technical Analysis of Solana (SOLUSD)
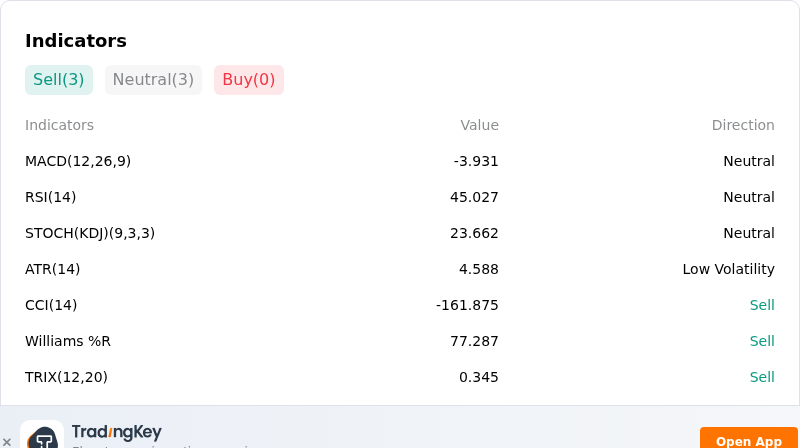
Technically, Solana (SOLUSD) shows a MACD (12,26,9) value of -3.931, indicating a neutral signal. The RSI at 45.027 suggests neutral condition and the Williams %R at 77.287 suggests sell condition. Please monitor closely.
More details about Solana (SOLUSD)
Recent Events and Risks:
- Spot ETF Outflows and Institutional Capital Flight: U.S. spot Solana exchange-traded funds recorded multiple consecutive sessions of net outflows, signaling waning institutional spot demand and eroding short-term buying pressure at key resistance levels.
- Perpetual Futures Over-Leverage and Liquidation Vulnerability: Heavy long exposure in Solana derivative markets has triggered millions of dollars in long liquidations following technical breakdowns below $117 support, leaving the token vulnerable to further forced selling if prices drop toward lower support levels.
- On-Chain Whale Unstaking and Centralized Exchange Inflows: Recent blockchain monitoring highlights significant whale unstaking activity alongside large multi-million-dollar transfers of SOL into exchange wallets, increasing active liquid float and generating immediate overhead spot selling pressure.
- Macro Risk-Off Sentiment and Altcoin De-risking: Broad cryptocurrency market sell-offs combined with firm U.S. Treasury yields and dollar strength have heavily impacted Solana, causing the high-beta altcoin to experience outsized downside volatility relative to the broader market.
Recommended Articles


