


Micron Technology Inc Stock (MU) Moved Down by 3.91% on Oct 8: A Full Analysis
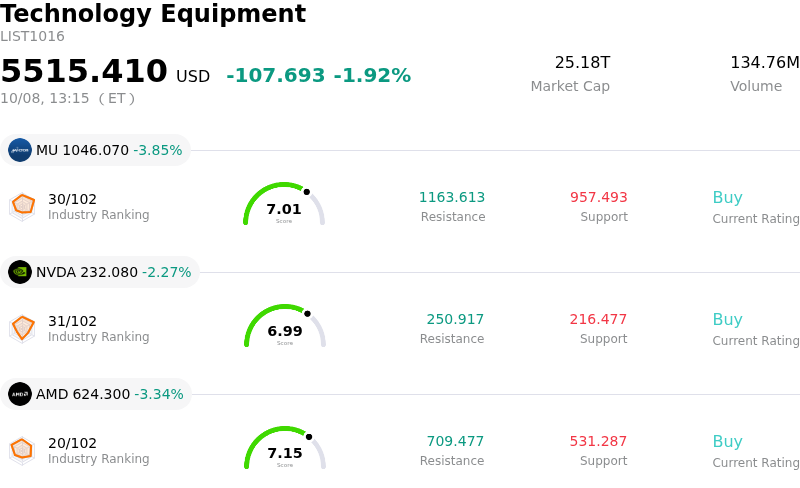
Micron Technology Inc (MU) moved down by 3.91%. The Technology Equipment sector is down by 1.92%. The company underperformed the industry. Top 3 stocks by turnover in the sector: Micron Technology Inc (MU) down 3.91%; NVIDIA Corp (NVDA) down 2.20%; Advanced Micro Devices Inc (AMD) down 3.38%.
What is driving Micron Technology Inc (MU)’s stock price down today?
Micron Technology experienced downward pressure as market participants digested emerging operational risks alongside profit-taking in the high-flying semiconductor sector. The primary catalyst driving negative sentiment was news of potential labor disruptions at the company's manufacturing footprint in Taiwan. Members of a major labor union representing workers at a key Taiwan facility voted overwhelmingly to authorize strike action over profit-sharing terms following the company's record financial results. Given Taiwan's strategic importance to Micron's memory chip production, the threat of potential supply disruptions introduced heightened uncertainty, prompting short-term risk reduction among institutional investors.
Beyond labor concerns, peak-cycle skepticism continues to create volatility for the stock. Despite Micron's outstanding fiscal fourth-quarter results and strong forward guidance driven by artificial intelligence demand for high-bandwidth memory, some market participants remain cautious about the long-term sustainability of memory pricing and margins. Debates surrounding heavy capital expenditure requirements, future industry supply additions, and the historical cyclicality of memory markets have led to bouts of profit-taking, particularly after recent aggressive price target upgrades by Wall Street analysts created a crowded long position.
From a strategic perspective, Micron's underlying fundamental outlook remains supported by tight memory supply-demand dynamics and long-term customer commitments across cloud and AI infrastructure partners. However, in the immediate term, ongoing labor mediation efforts in Asia and broader profit-taking across tech equities are likely to keep price action volatile. Investors will be closely monitoring how management navigates labor negotiations and executes on its planned capital return strategy heading into the end of the year.
Technical Analysis of Micron Technology Inc (MU)
Technically, Micron Technology Inc (MU) shows a MACD (12,26,9) value of -6.203, indicating a neutral signal. The RSI at 52.807 suggests neutral condition and the Williams %R at 63.556 suggests sell condition. Please monitor closely.
Media Coverage of Micron Technology Inc (MU)
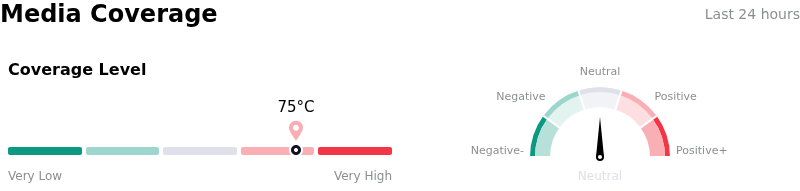
In terms of media coverage, Micron Technology Inc (MU) shows a coverage score of 75, indicating a high level of media attention. The overall market sentiment index is currently in neutral zone.
Fundamental Analysis of Micron Technology Inc (MU)
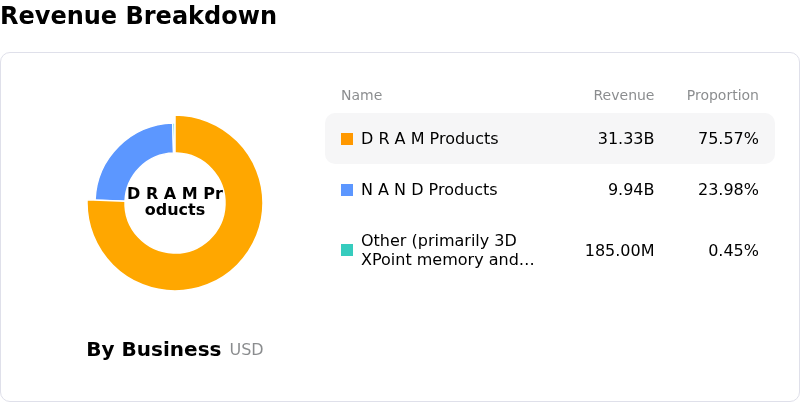
Micron Technology Inc (MU) is in the Technology Equipment industry. Its latest annual revenue is $133.19B, ranking 2 in the industry. The net profit is $84.97B, ranking 2 in the industry. Company Profile
Over the past month, multiple analysts have rated the company as Buy, with an average price target of $1480.81, a high of $2100.00, and a low of $190.00.
More details about Micron Technology Inc (MU)
Company Specific Risks:
- Labor Disruption and Taiwan Strike Authorization: Members of Micron's Taoyuan labor union in Taiwan voted 99% in favor of authorizing a strike over operating profit allocation. Because Taiwan hosts a major portion of Micron's DRAM output, potential work stoppages and upcoming mediation with the larger 11,000-member Taichung union present substantial operational and supply chain risks.
- Peak Memory Supercycle and Margin Normalization: Institutional analyst commentary highlights growing concern over the long-term sustainability of Micron's peak gross and operating margins. Skepticism remains that record earnings are primarily driven by temporary HBM pricing tightness rather than structural volume expansion, creating downside exposure should memory pricing normalize toward fiscal 2028.
- Heavy Insider Divestment and Delayed Buyback Ramp: Recent SEC Form 4 disclosures reveal elevated insider selling activity totaling over $381 million over the past year. Additionally, capital return execution remains restricted, with management spending only $650 million on share repurchases in fiscal 2026 despite generating nearly $59 billion in free cash flow, as CHIPS Act restrictions delay accelerated buybacks until late December 2026.
- Patent Litigation Liabilities and Ongoing Licensing Expenses: Recent intellectual property dispute resolutions, including a $600 million patent settlement with Netlist requiring recurring quarterly licensing payments over five years, introduce persistent financial liabilities that add non-operational margin pressure.
Recommended Articles


