


Fortinet Inc Stock (FTNT) Moved Up by 3.09% on Oct 6: What Investors Need To Know
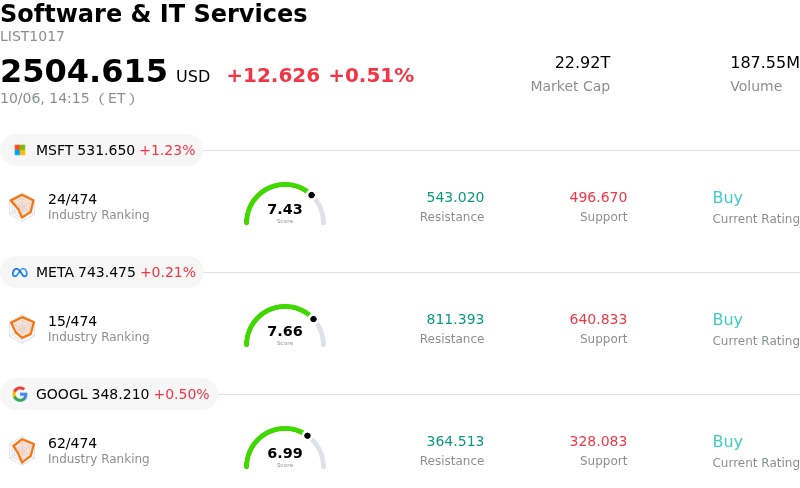
Fortinet Inc (FTNT) moved up by 3.09%. The Software & IT Services sector is up by 0.51%. The company outperformed the industry. Top 3 stocks by turnover in the sector: Microsoft Corp (MSFT) up 1.22%; Meta Platforms Inc (META) up 0.21%; Alphabet Inc Class A (GOOGL) up 0.50%.
What is driving Fortinet Inc (FTNT)’s stock price up today?
Fortinet experienced a notable upward trajectory accompanied by heightened intraday volatility, driven by persistent bullish sentiment across the cybersecurity sector and expanding enterprise demand for integrated network security solutions. As corporate capital expenditure toward artificial intelligence infrastructure and data center expansion accelerates, securing complex hybrid environments has become a critical strategic priority. This broader thematic tailwind has positioned established cybersecurity leaders with cloud-native security and Secure Access Service Edge capabilities as prime beneficiaries of enterprise budget allocation.
Fundamental drivers were further reinforced by positive earnings model adjustments and constructive coverage from Wall Street research firms. Analysts have increasingly highlighted the company's expanding AI security portfolio, robust cash flow generation, and high operational margins following prior management guidance increases. Upgraded earnings estimates have strengthened investor conviction regarding top-line sustainability, encouraging institutional portfolio adjustments and attracting momentum-focused buyers into the stock.
The observed intraday price volatility reflects active trading dynamics near record technical levels alongside strategic positioning ahead of the company's upcoming quarterly financial results release. While elevated valuation multiples continue to generate tactical back-and-forth trading between short-term profit-takers and long-term institutional investors, overall market sentiment remains anchored by strong fundamental tailwinds and favorable industry trends.
Technical Analysis of Fortinet Inc (FTNT)
Technically, Fortinet Inc (FTNT) shows a MACD (12,26,9) value of 2.151, indicating a buy signal. The RSI at 71.293 suggests buy condition and the Williams %R at 9.009 suggests overbought condition. Please monitor closely.
Media Coverage of Fortinet Inc (FTNT)
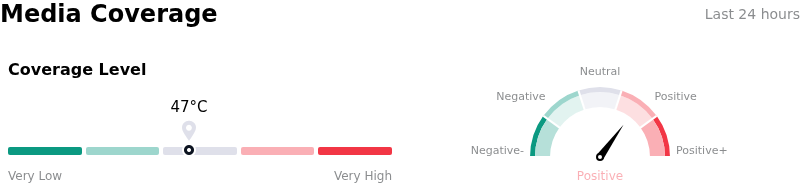
In terms of media coverage, Fortinet Inc (FTNT) shows a coverage score of 47, indicating a moderate level of media attention. The overall market sentiment index is currently in bullish zone.
Fundamental Analysis of Fortinet Inc (FTNT)
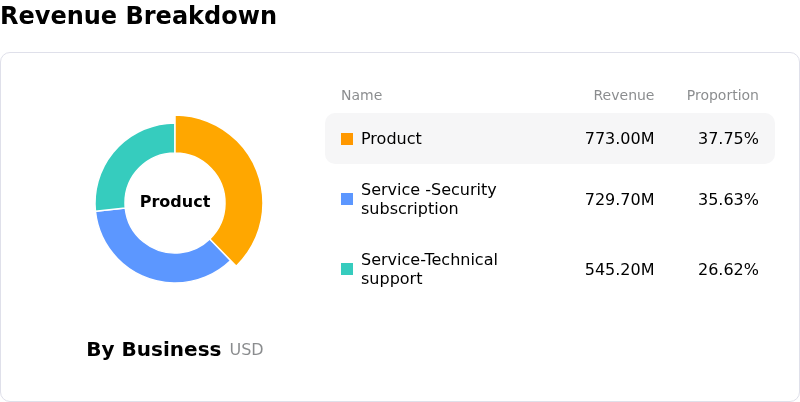
Fortinet Inc (FTNT) is in the Software & IT Services industry. Its latest annual revenue is $6.80B, ranking 49 in the industry. The net profit is $1.85B, ranking 29 in the industry. Company Profile
Over the past month, multiple analysts have rated the company as Hold, with an average price target of $163.76, a high of $220.00, and a low of $99.00.
More details about Fortinet Inc (FTNT)
Company Specific Risks:
- Valuation Premium and Downside Price Target Risk: Following a surge to new highs around $185–$192, institutional consensus price targets of $152.79 signal up to 17% downside risk, with analysts warning that the current price-to-earnings multiple is overstretched relative to expected near-term earnings growth.
- Post-Upgrade Cycle Growth Deceleration: The company's recent surge in product billings is heavily reliant on a temporary hardware firewall refresh cycle, which analyst forecasts indicate will taper off, leading to normalized single-digit EPS growth and revenue deceleration in coming quarters.
- Enterprise Competition and Platform Consolidation Threat: Ongoing platform consolidation by key enterprise cybersecurity competitors like Palo Alto Networks, CrowdStrike, and Zscaler poses structural risks to Fortinet's firewall market share and expansion into Unified SASE solutions.
- Potential Operating Margin Compression: Near-term guidance targeting non-GAAP operating margins of 35.0% to 37.0% indicates potential margin compression compared to prior peak performance (36.9%), threatening negative operating leverage if sales and marketing investments outpace billings growth.
Recommended Articles


