

Ge Vernova Inc Stock (GEV) Moved Up by 3.90% on Oct 1: What Investors Need To Know

Source Tradingkey

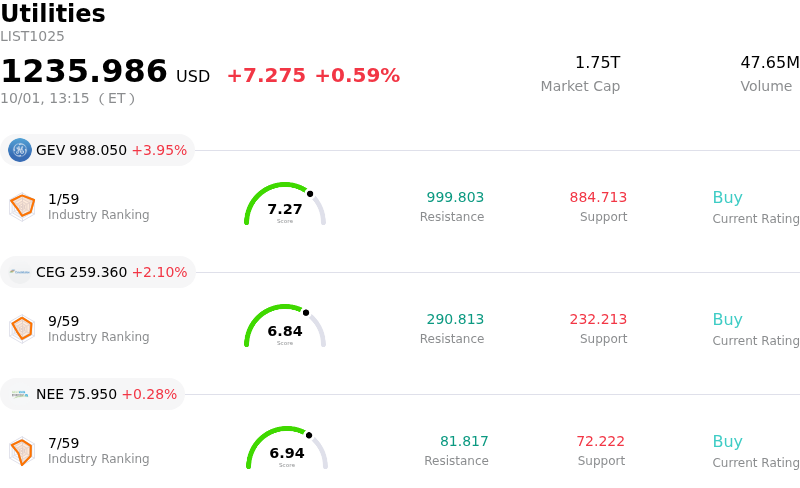
Ge Vernova Inc (GEV) moved up by 3.90%. The Utilities sector is up by 0.59%. The company outperformed the industry. Top 3 stocks by turnover in the sector: Ge Vernova Inc (GEV) up 3.90%; Constellation Energy Corp (CEG) up 2.10%; Nextera Energy Inc (NEE) up 0.28%.
SummaryOverview

What is driving Ge Vernova Inc (GEV)’s stock price up today?

GE Vernova experienced positive trading momentum driven by a combination of bullish sell-side Wall Street updates and continued expansion in its core electrification and power segments. Evercore ISI raised its multi-year earnings projections for the company while reiterating an Outperform rating, pointing to stronger-than-expected order momentum across both Power and Electrification divisions. Analysts emphasized that surging demand for power grid infrastructure and gas turbine capacity could accelerate the company's trajectory toward reaching a major milestone in total backlog ahead of schedule. Further supporting institutional confidence, major brokerages including Baird and Jefferies reiterated buy-equivalent ratings, highlighting underappreciated value in long-term services annuities and high-margin grid modernization technologies.

The broader fundamental narrative continues to be anchored by robust secular growth trends tied to artificial intelligence data center deployment and global grid modernization. Utilities and hyperscale technology firms are increasingly contracting for reliable baseload power solutions, positioning GE Vernova as a key equipment and service provider across its gas turbine, nuclear, and electrification portfolios. In addition to expanding multi-year order visibility supported by a massive order backlog, the company reinforced its capital return commitment by declaring its regular quarterly dividend. This announcement underscores management's confidence in near-term free cash flow generation and balance sheet strength.

Despite the overall positive price movement, the stock exhibited notable intraday volatility as market participants weighed bullish structural catalysts against elevated valuation multiples following substantial gains over recent months. While short-term price chop reflects periodic profit-taking and broader industrial sector portfolio adjustments, the convergence of expanding profit margins, persistent power grid demand, and constructive institutional research continues to provide strong underlying support.

Technical Analysis of Ge Vernova Inc (GEV)

Technically, Ge Vernova Inc (GEV) shows a MACD (12,26,9) value of 14.933, indicating a neutral signal. The RSI at 57.646 suggests neutral condition and the Williams %R at 8.724 suggests overbought condition. Please monitor closely.

Media Coverage of Ge Vernova Inc (GEV)

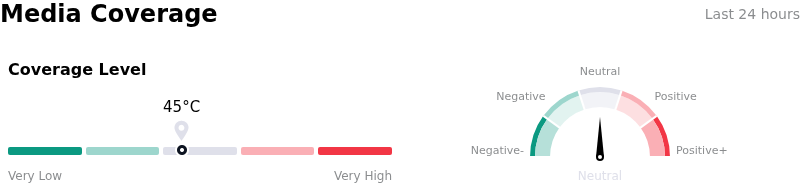
In terms of media coverage, Ge Vernova Inc (GEV) shows a coverage score of 45, indicating a moderate level of media attention. The overall market sentiment index is currently in neutral zone.
SentimentAnalysis

Fundamental Analysis of Ge Vernova Inc (GEV)

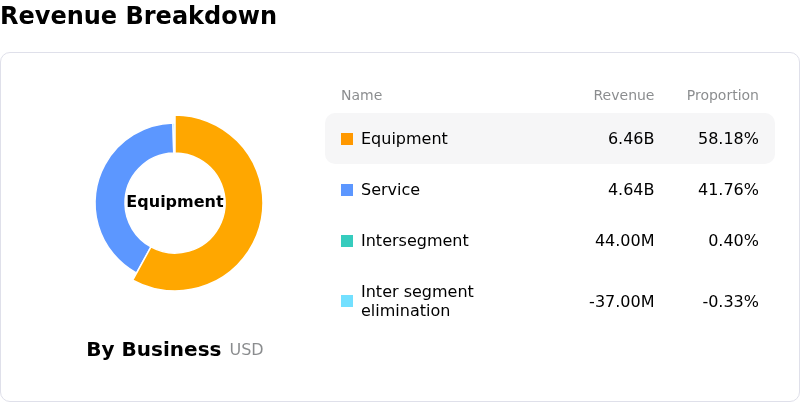
Ge Vernova Inc (GEV) is in the Utilities industry. Its latest annual revenue is $38.07B, ranking 2 in the industry. The net profit is $4.88B, ranking 4 in the industry. Company Profile
FundamentalAnalysis

Over the past month, multiple analysts have rated the company as Buy, with an average price target of $1182.18, a high of $1450.00, and a low of $470.00.

More details about Ge Vernova Inc (GEV)

Company Specific Risks:

  • Elevated Valuation Multiple: Shares trade at a steep EV/EBITDA valuation multiple above 62x and have slipped below key 50-day and 200-day moving averages, leaving the stock highly vulnerable to sharp intraday sell-offs on minor sentiment shifts.
  • Wind Segment Losses and Pricing Lag: Structural operational losses in the Wind Energy division combined with legacy 2024 fixed-price contracts for 2027 turbine deliveries create near-term risk of gross margin compression against elevated cost inflation.
  • Earnings Execution Volatility: Recent quarterly results included a steep 22% earnings-per-share (EPS) miss relative to Wall Street consensus, highlighting execution vulnerabilities and thin operating margins of approximately 5.3% despite strong top-line revenue growth.
  • Cyclical Peak and Order Intake Risk: Growing analyst caution regarding potential peak-cycle demand in gas-turbine and power generation assets threatens backlog growth momentum, increasing the stock's downside sensitivity to sector downgrades.
Disclaimer: For information purposes only. Past performance is not indicative of future results.
placeholder
October hike odds climb toward 60% as Goldman and BofA both flip — what Warsh's "dose of accommodation" really changedRate futures now price roughly 55% to 62% for a 25bp hike at the October 27-28 FOMC, up from about 30% before Chair Warsh's post-meeting framing that the Fed is merely "removing some accommodation." Goldman Sachs has added an October hike to its forecast and Bank of America now sees moves in both October and December. Here is the repricing, the language behind it, and the two data points that decide it.
Author  Irene Q.
Sep 23, Wed
Rate futures now price roughly 55% to 62% for a 25bp hike at the October 27-28 FOMC, up from about 30% before Chair Warsh's post-meeting framing that the Fed is merely "removing some accommodation." Goldman Sachs has added an October hike to its forecast and Bank of America now sees moves in both October and December. Here is the repricing, the language behind it, and the two data points that decide it.
placeholder
Four jobs reports in five days: what JOLTS, ADP, claims and the September payrolls mean for the October Fed decisionThe US labour market faces its densest data week of the month. JOLTS job openings land Tuesday (7.2 million expected), ADP on Wednesday (70,000 expected), initial claims on Thursday and the September non-farm payrolls on Friday (100,000 expected, down from 162,000). Markets price a 64%-70% chance of another quarter-point Fed hike on October 28. The dollar index sits at 100.77 and the S&P 500 at 7,729.8.
Author  Mitrade
Sep 28, Mon
The US labour market faces its densest data week of the month. JOLTS job openings land Tuesday (7.2 million expected), ADP on Wednesday (70,000 expected), initial claims on Thursday and the September non-farm payrolls on Friday (100,000 expected, down from 162,000). Markets price a 64%-70% chance of another quarter-point Fed hike on October 28. The dollar index sits at 100.77 and the S&P 500 at 7,729.8.
placeholder
Nvidia's $150 billion buyback landed — and the AI sector fell anyway. That's the signal worth tradingNvidia closed up 1.68% at $228.86 on 28 September after announcing a $150 billion share repurchase authorisation, the largest single corporate buyback on record, while the rest of the AI complex sold off: AMD -3.6%, Micron -2.6%, Meta -4.8% and the Philadelphia Semiconductor Index -1.61%. The divergence is not noise. Capital is rotating toward cash-flow certainty, not abandoning the AI theme. With Micron reporting after the close on 30 September, here is what the split means.
Author  Irene Q.
Sep 29, Tue
Nvidia closed up 1.68% at $228.86 on 28 September after announcing a $150 billion share repurchase authorisation, the largest single corporate buyback on record, while the rest of the AI complex sold off: AMD -3.6%, Micron -2.6%, Meta -4.8% and the Philadelphia Semiconductor Index -1.61%. The divergence is not noise. Capital is rotating toward cash-flow certainty, not abandoning the AI theme. With Micron reporting after the close on 30 September, here is what the split means.
placeholder
【Daily Brief】30-year Treasury tops 5.59%, S&P 500 slips to 7,670 and gold holds $4,180 — PCE lands tonightThe 30-year Treasury yield closed at 5.59%, its highest since June 2002, and the Dow fell 131.59 points to 51,349.92. US consumer confidence dropped to 81.9, a 12-year low, and JOLTS job openings fell to 7.1 million. August PCE and Q3 GDP both land at 8:30am ET tonight.
Author  Suzie
Sep 30, Wed
The 30-year Treasury yield closed at 5.59%, its highest since June 2002, and the Dow fell 131.59 points to 51,349.92. US consumer confidence dropped to 81.9, a 12-year low, and JOLTS job openings fell to 7.1 million. August PCE and Q3 GDP both land at 8:30am ET tonight.
placeholder
Gold falls to near $4,150 as higher Treasury yields, oil prices outweigh softer PCE inflationGold price (XAU/USD) tumbles to near $4,150 during the early Asian session on Thursday, pressured by elevated US Treasury bond yields. Traders await the US September employment data for fresh impetus, which will be released later on Friday. 
Author  FXStreet
Yesterday 01: 26
Gold price (XAU/USD) tumbles to near $4,150 during the early Asian session on Thursday, pressured by elevated US Treasury bond yields. Traders await the US September employment data for fresh impetus, which will be released later on Friday. 
goTop
quote