


Ethereum (ETHUSD) Suddenly Goes up 1.06% on Oct 1: What You Need to Watch
Ethereum (ETHUSD) is up 1.06% at Oct 1 01:05(ET), now at $2708.5, with a 7-day up of 0.85%.
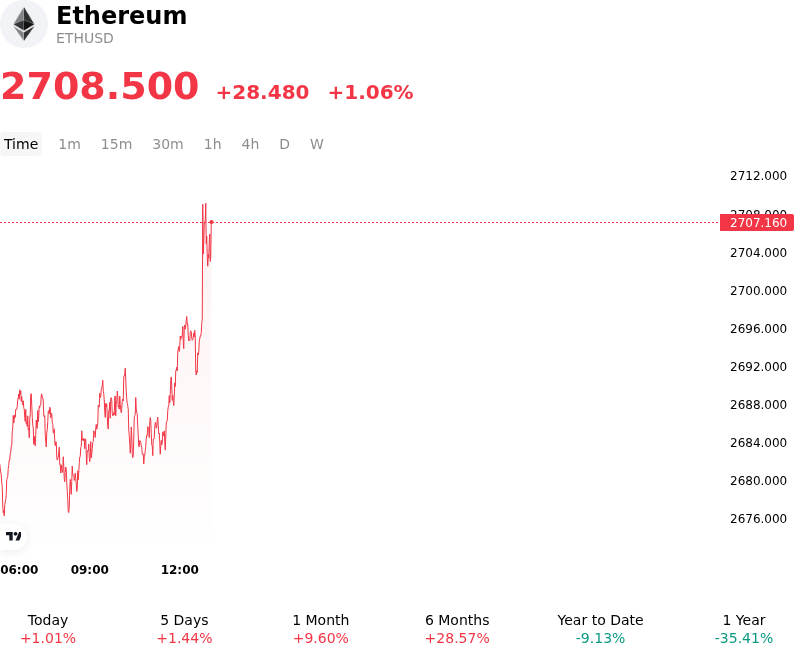
What is driving Ethereum (ETHUSD)’s stock price up today?
Ethereum advanced as positive market momentum returned at the start of the fourth quarter, driven by a combination of favorable macroeconomic conditions and renewed institutional capital flows. Expectations of continued monetary policy easing by the Federal Reserve, supported by cooling inflation data, stabilized Treasury yields, and a softer U.S. dollar, improved global macro liquidity conditions and rekindled broad risk appetite across digital asset markets. This macroeconomic backdrop provided solid fundamental support for top-tier smart contract assets, encouraging institutional trading desks to deploy fresh capital following quarter-end portfolio rebalancing. In tandem, sentiment was bolstered by a resumption of net positive spot Ethereum ETF inflows, reinforcing sustained institutional demand for regulated exposure.
Network-specific dynamics further amplified the upward price movement. Sustained expansion across Layer-2 ecosystems and steady growth in Total Value Locked within decentralized finance protocols increased network utilization and reinforced execution demand. Concurrently, high staking participation rates continued to lock up significant portions of the circulating supply, restricting available spot market depth and creating a tighter structural supply-demand balance. Ongoing corporate treasury allocations to the token also contributed to spot liquidity absorption, enhancing long-term institutional backing.
In the derivatives market, the push higher triggered a wave of short liquidations across major perpetual futures contracts, generating buy-side mechanical pressure that accelerated intraday momentum. Open interest rebounded constructively while options market positioning reflected an increasing appetite for fourth-quarter upside exposure. Although investors remain watchful of potential macroeconomic volatility, shifting Federal Reserve interest rate policy, and broader regulatory updates, the session's advance demonstrates a resilient market structure anchored by improving macro liquidity, steady ETF adoption, and tightening circulating supply.
Technical Analysis of Ethereum (ETHUSD)
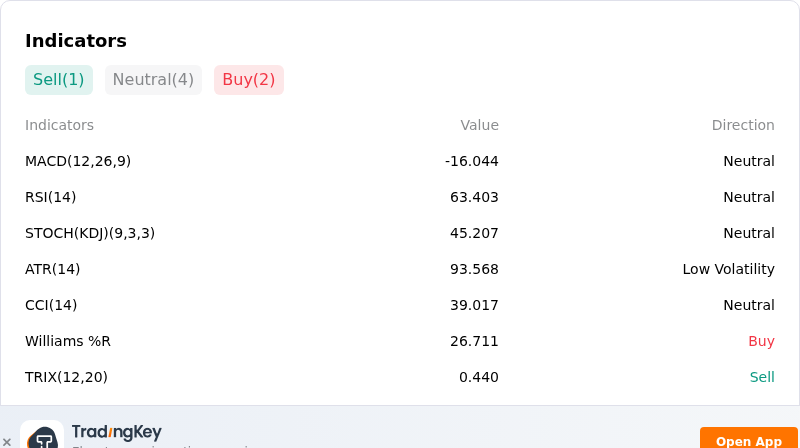
Technically, Ethereum (ETHUSD) shows a MACD (12,26,9) value of -16.044, indicating a neutral signal. The RSI at 63.403 suggests neutral condition and the Williams %R at 26.711 suggests buy condition. Please monitor closely.
More details about Ethereum (ETHUSD)
Recent Events and Risks:
- Spot ETF Outflow Reversal: Institutional demand has weakened as U.S. spot Ethereum ETFs broke a multi-day inflow streak with net daily outflows, removing a key source of spot accumulation and exposing the asset to heightened profit-taking pressure.
- Long Liquidation Cascade: A sharp intraday price drop triggered tens of millions of dollars in forced long liquidations on perpetual futures markets, creating a downside feedback loop as open interest declines and market makers reduce depth.
- Protocol Roadmap Uncertainty: Although the Glamsterdam upgrade is progressing to testnet activation, market uncertainty regarding the mainnet implementation timeline is weighing on investor sentiment, keeping ETH capped below major technical moving average resistance.
- Macro Risk-Off Headwinds: Persistently high interest rates and broader cross-asset weakness have pressured high-beta digital assets, driving leverage unwinding and reducing buy-side liquidity around key technical support levels.
Recommended Articles


