

Ethereum (ETHUSD) Volatility Intensified on Sep 29: What You Should Know

Source Tradingkey

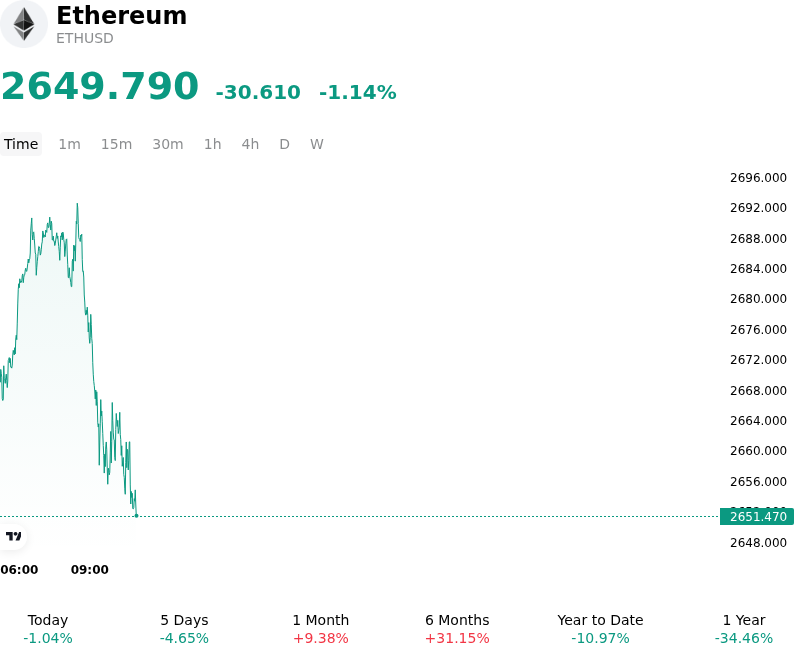
Ethereum (ETHUSD) is down 1.14% at Sep 29 22:35(ET), now at $2649.79, with a 7-day down of 3.61%.
SummaryOverview

What is driving Ethereum (ETHUSD)’s stock price down today?

Ethereum experienced a pull back as price action encountered firm overhead resistance near the key technical supply zone around the upper boundary of its recent trading range. Following a robust quarterly expansion that outpaced broader digital asset benchmarks, buyers met persistent sell liquidity at these multi-week highs. The inability to clear this key psychological threshold triggered short-term profit-taking and tactical portfolio rebalancing among both institutional and retail market participants.

Macroeconomic headwinds further constrained risk appetite across the broader digital asset ecosystem. U.S. Treasury yields remained elevated following robust economic data and persistent inflation expectations, lifting benchmark yields and reinforcing U.S. dollar strength. Higher real yields and lingering uncertainty regarding the Federal Reserve’s interest rate trajectory tightened macro liquidity conditions, capping speculative enthusiasm and encouraging traders to trim exposure in non-yielding risk assets.

Market structure dynamics amplified the intraday downside momentum through an unwinding of speculative leverage. Derivatives indicators showed a noticeable contraction in perpetual futures open interest and a decline in estimated leverage ratios across major exchanges. This flush of leveraged long positions occurred alongside a temporary moderation in spot Ethereum ETF net inflows, which had previously provided consistent buying pressure. With spot market liquidity relatively thin, modest selling volume was able to absorb resting bid orders, accelerating the downward drift.

Despite the short-term profit-taking, structural tailwinds continue to support the long-term outlook for the asset. High network staking participation and ongoing corporate treasury accumulation keep a significant portion of the total circulating supply locked on-chain, mitigating downside liquid float. Additionally, steady developer progress on upcoming network scalability upgrades and sustained Layer-2 adoption continue to bolster network utility. Market participants remain focused on macroeconomic liquidity shifts, spot ETF flow sustainability, and crucial technical support levels to assess whether this movement reflects routine price consolidation or a broader pause in institutional positioning.

Technical Analysis of Ethereum (ETHUSD)

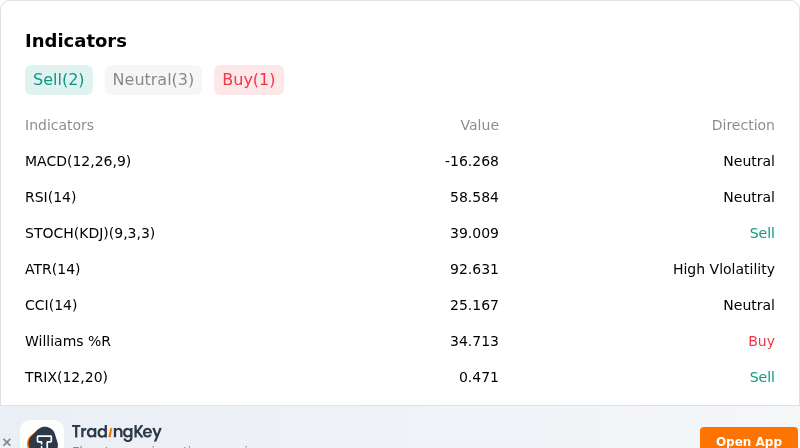
Technically, Ethereum (ETHUSD) shows a MACD (12,26,9) value of -16.268, indicating a neutral signal. The RSI at 58.584 suggests neutral condition and the Williams %R at 34.713 suggests buy condition. Please monitor closely.
IndicatorAnalysis

More details about Ethereum (ETHUSD)

Recent Events and Risks:

  • Derivatives Long Squeeze and Cascade Liquidations: Overextended leverage following Ethereum's retest of overhead resistance near $2,780–$2,800 triggered tens of millions of dollars in long-side liquidations across perpetual futures venues, exacerbating intraday order book slippage and pressing spot prices toward key technical support levels.
  • Spot ETF Net Outflows and Institutional Capital Drag: Spot Ethereum exchange-traded funds have recorded periodic net redemption sessions, demonstrating a temporary slowdown in institutional capital allocations that weakens the structural bid necessary to absorb ongoing spot market selling.
  • Legislative Delays and Whale Distribution: Policy uncertainty stemming from legislative inertia in the U.S. Senate regarding digital asset framework bills (such as the CLARITY Act) triggered short-term token distribution by mid-tier whale holders, increasing circulating supply on exchanges.
  • Macro Risk-Off Shift and Geopolitical Headwinds: Geopolitical friction alongside elevated U.S. Treasury yields and firming oil prices have spurred a broader risk-off environment, shifting investor capital toward defensive yield-bearing assets and pressuring liquidity across cryptocurrency markets.
Disclaimer: For information purposes only. Past performance is not indicative of future results.
placeholder
Gold ends three-week slide at the $4,400 line — eight straight days of ETF inflows vs a 5% 10-year and a 100 dollarSpot gold closed Friday at $4,378.39, up 0.84% on the day and about 0.8% for the week — its first weekly gain in four weeks — with the intraday high of $4,399.67 leaving it 33 cents shy of the $4,400 line. Gold ETFs have now logged eight straight sessions of inflows, but with the 10-year back above 5% and the dollar index near 100, here is what decides whether this is a reversal or a bounce.
Author  Suzie
Sep 20, Sun
Spot gold closed Friday at $4,378.39, up 0.84% on the day and about 0.8% for the week — its first weekly gain in four weeks — with the intraday high of $4,399.67 leaving it 33 cents shy of the $4,400 line. Gold ETFs have now logged eight straight sessions of inflows, but with the 10-year back above 5% and the dollar index near 100, here is what decides whether this is a reversal or a bounce.
placeholder
October hike odds climb toward 60% as Goldman and BofA both flip — what Warsh's "dose of accommodation" really changedRate futures now price roughly 55% to 62% for a 25bp hike at the October 27-28 FOMC, up from about 30% before Chair Warsh's post-meeting framing that the Fed is merely "removing some accommodation." Goldman Sachs has added an October hike to its forecast and Bank of America now sees moves in both October and December. Here is the repricing, the language behind it, and the two data points that decide it.
Author  Irene Q.
Sep 23, Wed
Rate futures now price roughly 55% to 62% for a 25bp hike at the October 27-28 FOMC, up from about 30% before Chair Warsh's post-meeting framing that the Fed is merely "removing some accommodation." Goldman Sachs has added an October hike to its forecast and Bank of America now sees moves in both October and December. Here is the repricing, the language behind it, and the two data points that decide it.
placeholder
Four jobs reports in five days: what JOLTS, ADP, claims and the September payrolls mean for the October Fed decisionThe US labour market faces its densest data week of the month. JOLTS job openings land Tuesday (7.2 million expected), ADP on Wednesday (70,000 expected), initial claims on Thursday and the September non-farm payrolls on Friday (100,000 expected, down from 162,000). Markets price a 64%-70% chance of another quarter-point Fed hike on October 28. The dollar index sits at 100.77 and the S&P 500 at 7,729.8.
Author  Mitrade
Yesterday 06: 33
The US labour market faces its densest data week of the month. JOLTS job openings land Tuesday (7.2 million expected), ADP on Wednesday (70,000 expected), initial claims on Thursday and the September non-farm payrolls on Friday (100,000 expected, down from 162,000). Markets price a 64%-70% chance of another quarter-point Fed hike on October 28. The dollar index sits at 100.77 and the S&P 500 at 7,729.8.
placeholder
Nvidia's $150 billion buyback landed — and the AI sector fell anyway. That's the signal worth tradingNvidia closed up 1.68% at $228.86 on 28 September after announcing a $150 billion share repurchase authorisation, the largest single corporate buyback on record, while the rest of the AI complex sold off: AMD -3.6%, Micron -2.6%, Meta -4.8% and the Philadelphia Semiconductor Index -1.61%. The divergence is not noise. Capital is rotating toward cash-flow certainty, not abandoning the AI theme. With Micron reporting after the close on 30 September, here is what the split means.
Author  Irene Q.
8 hours ago
Nvidia closed up 1.68% at $228.86 on 28 September after announcing a $150 billion share repurchase authorisation, the largest single corporate buyback on record, while the rest of the AI complex sold off: AMD -3.6%, Micron -2.6%, Meta -4.8% and the Philadelphia Semiconductor Index -1.61%. The divergence is not noise. Capital is rotating toward cash-flow certainty, not abandoning the AI theme. With Micron reporting after the close on 30 September, here is what the split means.
placeholder
The 30-year Treasury just hit a 22-year high — and the bond market is not pricing the Fed, it is pricing the deficitThe 30-year Treasury yield closed at 5.56% on 28 September, the highest since June 2004, while the 10-year reached 5.24% and the 20-year 5.60%. The curve has steepened roughly 30bp in eight sessions even as October hike odds sit at 70.3%. That gap is the story: the long end is repricing fiscal and inflation risk, not policy. With PCE on Wednesday and payrolls on Friday, here is what the long end is really saying.
Author  Irene Q.
8 hours ago
The 30-year Treasury yield closed at 5.56% on 28 September, the highest since June 2004, while the 10-year reached 5.24% and the 20-year 5.60%. The curve has steepened roughly 30bp in eight sessions even as October hike odds sit at 70.3%. That gap is the story: the long end is repricing fiscal and inflation risk, not policy. With PCE on Wednesday and payrolls on Friday, here is what the long end is really saying.
goTop
quote