


BNB (BNBUSD) Is down 1.18% on Sep 29: Key Drivers to Watch
BNB (BNBUSD) is down 1.18% at Sep 29 21:30(ET), now at $754.2, with a 7-day down of 3.67%.
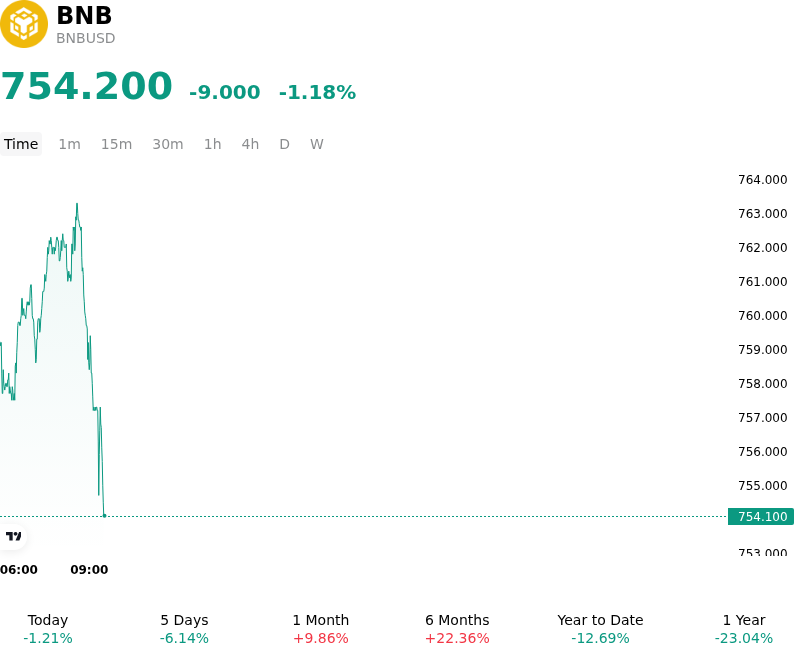
What is driving BNB (BNBUSD)’s stock price down today?
Macro liquidity pressures and elevated risk-free yields weighed on digital asset valuations, contributing to the intraday retreat in BNB. A stronger U.S. dollar alongside elevated U.S. Treasury yields tightened short-term liquidity conditions, reducing investor appetite for risk assets across traditional and digital markets. Broader cryptocurrency market sentiment shifted into a temporary consolidative phase as major digital benchmarks encountered overhead resistance, triggering modest profit-taking and long liquidations across major altcoins following a multi-session expansion.
From a technical and positioning perspective, BNB encountered selling pressure near key psychological resistance levels, prompting short-term market participants to de-risk and realize gains. Derivatives metrics indicated a brief cooling off in leverage, with funding rates stabilizing as traders recalibrated exposure in response to shifting macroeconomic conditions. The pause in upward momentum represents a localized repricing of risk sentiment rather than a fundamental deterioration in market structure.
On-chain and structural ecosystem indicators continue to provide a solid baseline for the asset's longer-term valuation framework. Sustained transaction volume and high daily active user engagement across the BNB Smart Chain, coupled with recurring protocol token burns, maintain constructive supply-demand fundamentals. Institutional participation also remains an underlying structural tailwind, backed by asset manager allocations, expanding smart contract fund rebalancings, and ongoing regulatory reviews for spot exchange-traded products. In addition, continued exchange utility optimizations and strategic integration initiatives reinforce the token's central position within ecosystem liquidity.
Overall, the intraday downside movement reflects a macro-driven risk adjustment and technical profit-taking period. Institutional investors continue to monitor broader global liquidity trends, U.S. dollar trajectory, and leverage conditions across major crypto derivatives venues. Provided that fundamental chain activity and core market liquidity remain stable, the move appears consistent with a healthy consolidation phase within a broader market cycle.
Technical Analysis of BNB (BNBUSD)
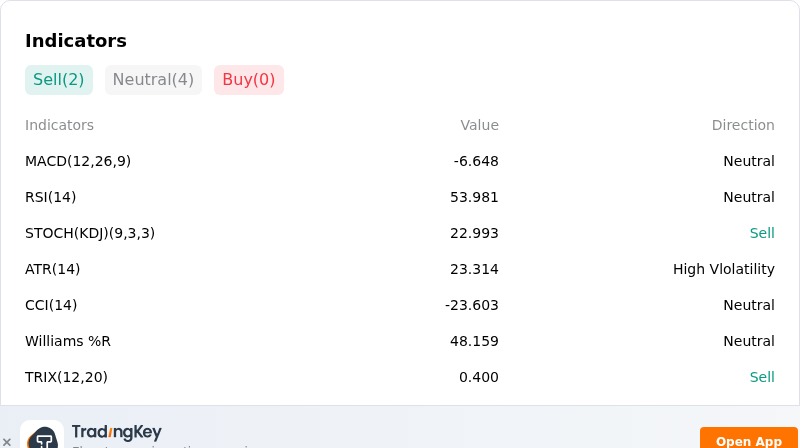
Technically, BNB (BNBUSD) shows a MACD (12,26,9) value of -6.648, indicating a neutral signal. The RSI at 53.981 suggests neutral condition and the Williams %R at 48.159 suggests neutral condition. Please monitor closely.
More details about BNB (BNBUSD)
Recent Events and Risks:
- Regulatory and Compliance Overhang: Extended legal scrutiny surrounding Binance's global exchange operations, alongside upcoming altcoin compliance regulations in major jurisdictions and ongoing MiCA framework hurdles in Europe, continues to cap institutional risk appetite and maintain headline risk for BNB.
- Technical Resistance Rejection and Long De-risking: Price rejection near the psychological $800 resistance zone has triggered short-term derivative unwinding, with weakening intraday momentum and negative MACD indicators exposing concentrated long liquidation clusters near lower support bands.
- On-Chain DEX Activity and Fee Compression: BNB Chain decentralized exchange metrics have softened, highlighted by a notable single-day decline of over 25% in PancakeSwap daily protocol fees, which reduces gas consumption, slows token burn velocity, and dampens short-term network utility.
- Capital Drain via High Bitcoin Dominance: Bitcoin market dominance holding near 58.7%, combined with firming U.S. Treasury yields, is encouraging capital rotation out of major altcoins and into primary collateral assets, heightening liquidity thinness across BNB trading pairs.
Recommended Articles


