

USD/JPY Price Forecast: 50-day SMA caps recovery near 158.00

Source Fxstreet
  • USD/JPY steadies near 157.40 as post-intervention recovery loses momentum.
  • RSI retreats toward neutral, pointing to further consolidation ahead.
  • Break above 158.28 exposes 159.00, 159.57 and 160.00 next.

The USD/JPY registers modest gains of 0.08% on Wednesday after US inflation data trimmed market bets on a Federal Reserve rate hike at the October 28 meeting. At the time of writing, the pair trades at 157.42.

USD/JPY Price Forecast: Technical Outlook

Price action shows that USD/JPY is neutral to downward-biased, following the last intervention by US and Japanese authorities, which pushed the pair from around 160.00 to 153.00 before recovering some ground to the current exchange rate.

Momentum favoured buyers, but recently sellers have stepped in as the Relative Strength Index (RSI) peaked at 60 before reversing to the 50-neutral level, indicating that further consolidation lies ahead.

For a bullish continuation, the pair must climb above the 50-day Simple Moving Average (SMA) at 158.28. Above the next resistance is 159.00, followed by the 100-day SMA at 159.57. UP next lies 160.00.

On the flip side, if USD/JPY dives below the low of the day (LOD) of 156.38, it opens the door to challenge 156.00. A breach of the latter will expose the May 6 low of 155.04, followed by the September 8 low of 152.89.

USD/JPY Price Chart – Daily
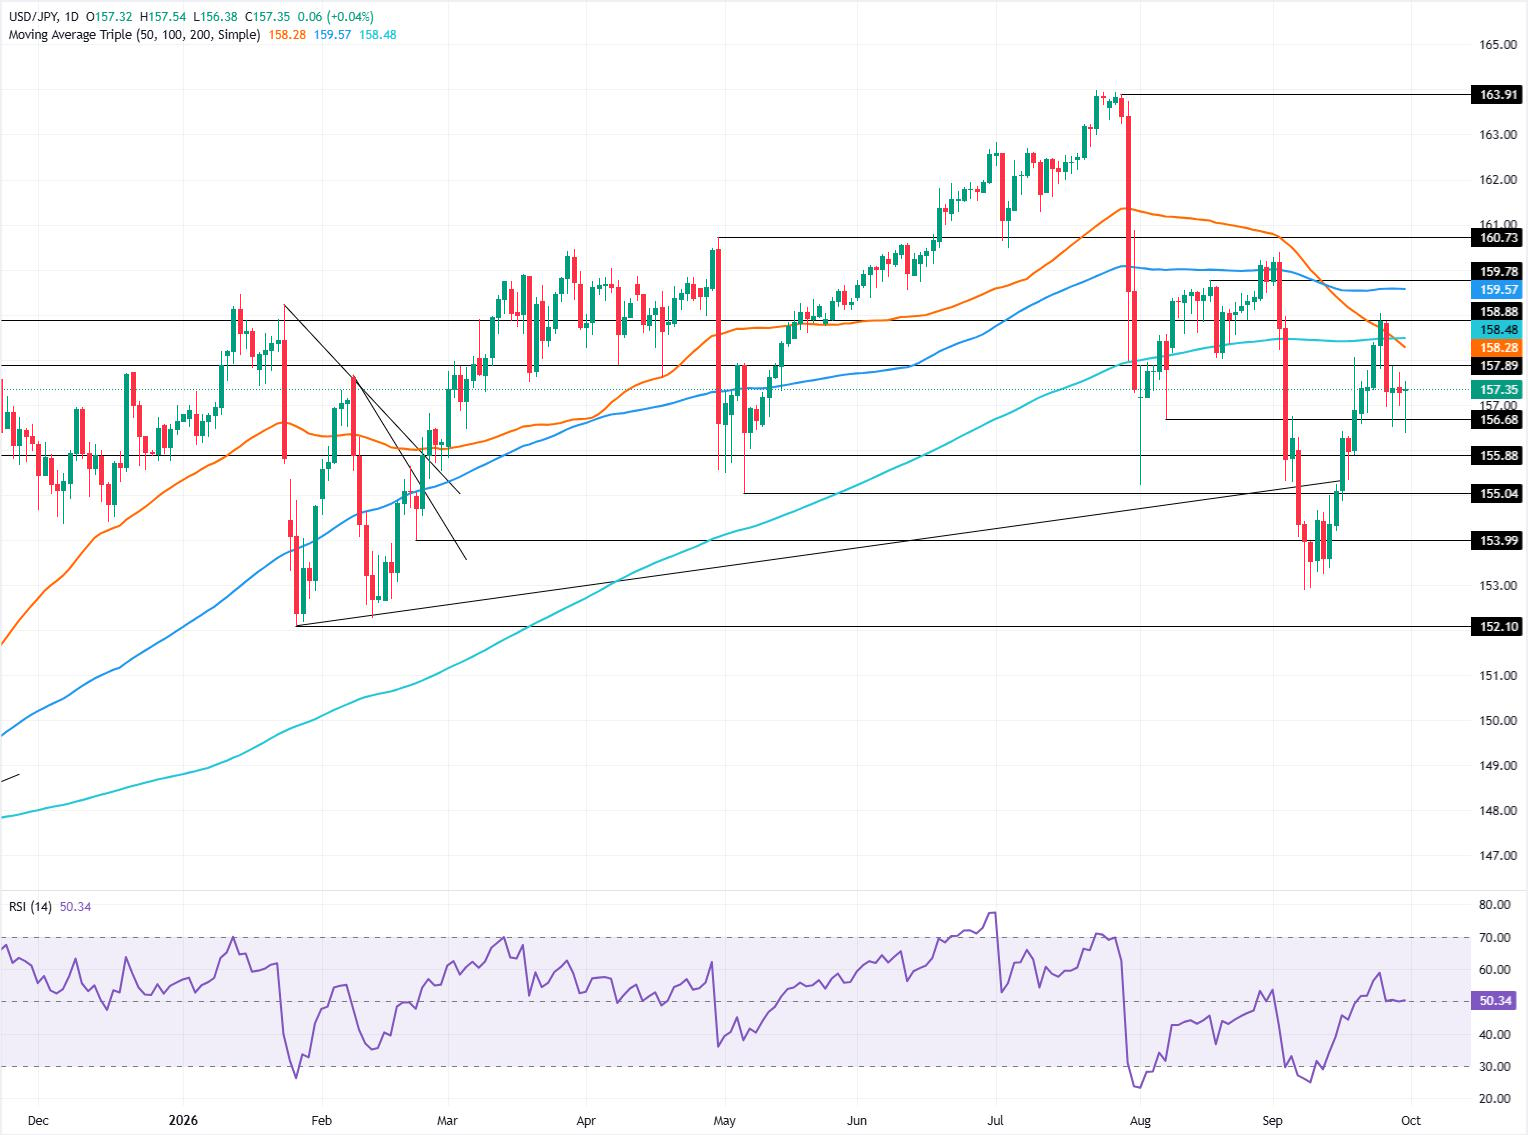
USD/JPY daily chart

Japanese Yen Price This Month

The table below shows the percentage change of Japanese Yen (JPY) against listed major currencies this month. Japanese Yen was the strongest against the New Zealand Dollar.

USD EUR GBP JPY CAD AUD NZD CHF
USD 2.53% 2.13% -1.49% 2.73% 3.17% 4.97% 3.35%
EUR -2.53% -0.37% -3.92% 0.16% 0.64% 2.41% 0.82%
GBP -2.13% 0.37% -3.57% 0.54% 1.01% 2.78% 1.21%
JPY 1.49% 3.92% 3.57% 4.26% 4.75% 6.51% 5.02%
CAD -2.73% -0.16% -0.54% -4.26% 0.48% 2.17% 0.65%
AUD -3.17% -0.64% -1.01% -4.75% -0.48% 1.74% 0.19%
NZD -4.97% -2.41% -2.78% -6.51% -2.17% -1.74% -1.54%
CHF -3.35% -0.82% -1.21% -5.02% -0.65% -0.19% 1.54%

The heat map shows percentage changes of major currencies against each other. The base currency is picked from the left column, while the quote currency is picked from the top row. For example, if you pick the Japanese Yen from the left column and move along the horizontal line to the US Dollar, the percentage change displayed in the box will represent JPY (base)/USD (quote).

Disclaimer: For information purposes only. Past performance is not indicative of future results.
placeholder
WTI Price Forecast: Dips to $91.50 as Middle East jitters limit lossesWest Texas Intermediate (WTI) – the benchmark US Crude Oil price – attracts some sellers during the Asian session on Friday, snapping a two-day winning streak and stalling the previous day's recovery from the vicinity of a nearly four-week low.
Author  FXStreet
10 hours ago
West Texas Intermediate (WTI) – the benchmark US Crude Oil price – attracts some sellers during the Asian session on Friday, snapping a two-day winning streak and stalling the previous day's recovery from the vicinity of a nearly four-week low.
placeholder
Silver price forecast: XAG/USD rises to near $61.40 as US yields retreat, NFP eyedSilver price (XAG/USD) is up 0.55% to near $61.38 during the late Asian trading session on Friday. The white metal edges up as rally in United States (US) Treasury Yields has hit a pause.
Author  FXStreet
10 hours ago
Silver price (XAG/USD) is up 0.55% to near $61.38 during the late Asian trading session on Friday. The white metal edges up as rally in United States (US) Treasury Yields has hit a pause.
placeholder
United States Dollar Index sits near March 2025 highs, above 102.00 ahead of US NFPThe US Dollar Index (DXY), which tracks the Greenback against a basket of currencies, attracts buyers for the fifth straight day and climbs back above the 102.00 mark during the Asian session on Friday.
Author  FXStreet
14 hours ago
The US Dollar Index (DXY), which tracks the Greenback against a basket of currencies, attracts buyers for the fifth straight day and climbs back above the 102.00 mark during the Asian session on Friday.
placeholder
US September Nonfarm Payrolls Preview: Job Growth May Cool, How Will US Stocks, Dollar and Gold React?On Friday, October 2 (EDT), the U.S. will release its September nonfarm payrolls report, with markets focusing on whether job growth can sustain August's rebound and whether the data will
Author  TradingKey
Yesterday 06: 21
On Friday, October 2 (EDT), the U.S. will release its September nonfarm payrolls report, with markets focusing on whether job growth can sustain August's rebound and whether the data will
placeholder
Gold falls to near $4,150 as higher Treasury yields, oil prices outweigh softer PCE inflationGold price (XAU/USD) tumbles to near $4,150 during the early Asian session on Thursday, pressured by elevated US Treasury bond yields. Traders await the US September employment data for fresh impetus, which will be released later on Friday. 
Author  FXStreet
Yesterday 01: 26
Gold price (XAU/USD) tumbles to near $4,150 during the early Asian session on Thursday, pressured by elevated US Treasury bond yields. Traders await the US September employment data for fresh impetus, which will be released later on Friday. 
Related Instrument
goTop
quote