

Solana (SOLUSD) Is down 1.03% on Sep 28: Why It Happened

Source Tradingkey

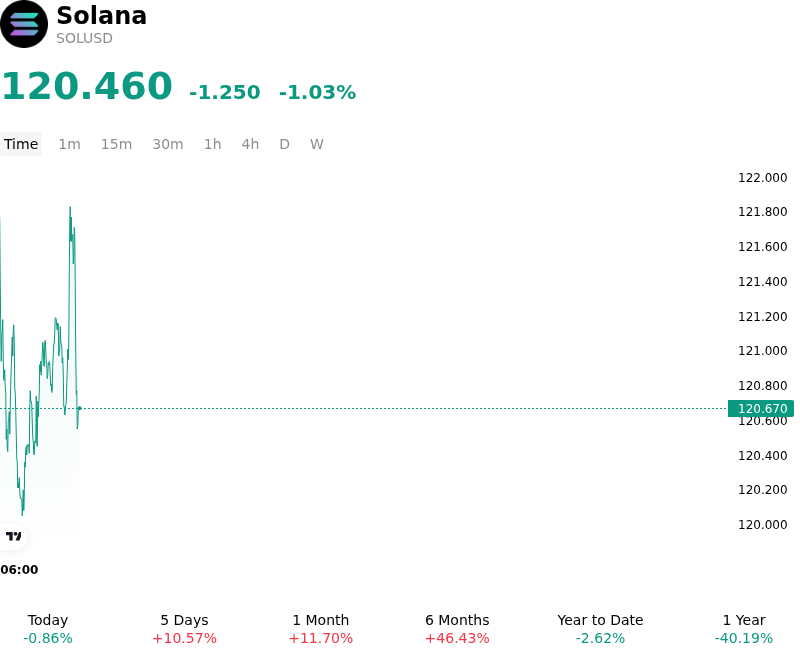
Solana (SOLUSD) is down 1.03% at Sep 28 20:40(ET), now at $120.46, with a 7-day up of 1.92%.
SummaryOverview

What is driving Solana (SOLUSD)’s stock price down today?

The recent pullback in Solana reflects a localized pause and profit-taking episode following a substantial multi-session rally that pushed the asset through key technical resistance to multi-month highs. After testing the upper boundaries of its recent range, spot buying momentum encountered firm overhead resistance, prompting short-term tactical traders and derivatives market participants to lock in gains. The retracement was further reinforced by elevated relative strength indicators on daily timeframes, which signaled overbought conditions and prompted systematic de-risking from momentum-oriented trading models.

From a capital flows and positioning perspective, the intraday softer tone corresponds to a cooling of leverage in the futures market after days of rapid expansion in open interest. While institutional spot demand and on-chain activity have provided an ongoing structural tailwind, net intraday spot inflows temporarily ebbed as market participants paused ahead of emerging macroeconomic signals. Perpetual swap funding rates moderated, pointing to a routine reduction in speculative long positioning rather than an aggressive turn toward net-short sentiment or broader institutional distribution. On-chain supply metrics on exchanges remained disciplined, suggesting that spot holders chose to sit tight rather than liquidate positions into the dip.

Looking ahead, market participants generally view this intraday decline as a healthy consolidation within an improving medium-term technical structure rather than a fundamental trend reversal. Underlying network health remains supported by robust staking participation and steady ecosystem fee generation. However, institutional investors continue to monitor broader macroeconomic risks, including shifting Federal Reserve policy expectations, US Dollar strength, and overall risk-asset appetite, to gauge the sustainability of liquidity conditions across digital asset markets.

Technical Analysis of Solana (SOLUSD)

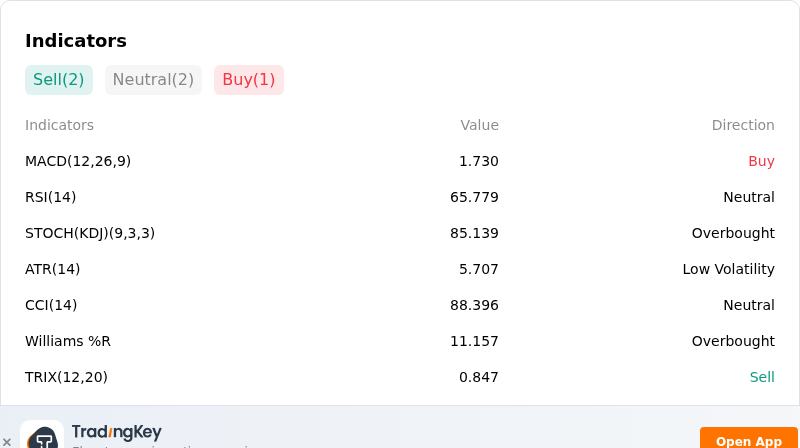
Technically, Solana (SOLUSD) shows a MACD (12,26,9) value of 1.730, indicating a buy signal. The RSI at 65.779 suggests neutral condition and the Williams %R at 11.157 suggests overbought condition. Please monitor closely.
IndicatorAnalysis

More details about Solana (SOLUSD)

Recent Events and Risks:

  • Overbought Technicals and Overhead Resistance: Following a fast rally toward $123.90, SOL’s daily Relative Strength Index (RSI) entered overbought territory above 70 while meeting major resistance at $122–$127. A failure to cleanly break through $124 leaves the pair vulnerable to intraday profit-taking and a downside correction toward underlying support levels at $112 and $106.
  • Alpenglow Mainnet Upgrade Activation Uncertainties: The tentative mainnet release of the Alpenglow consensus upgrade (Agave v4.3) requires 95% validator consensus on the new client version prior to activation. Validator coordination delays, unconfirmed activation timing, or potential software implementation bugs present immediate operational and execution risks.
  • Staking Reward Compression Following SIMD-0550 Vote: The narrow passage of the SIMD-0550 disinflation proposal doubles the network's issuance reduction rate, decreasing first-year validator staking yields from 4.93% to roughly 4.34%. The drop in nominal yield, paired with low real returns after inflation, threatens to disincentivize delegators and spark epoch-based unstaking pressure.
  • Elevated Derivatives Open Interest and Liquidation Cascades: Futures open interest expanded to $7.49 billion with long/short positioning heavily weighted toward long accounts (~1.89 ratio). Concentrated leverage leaves SOL exposed to sharp, intraday deleveraging cascades if prices decline below immediate support triggers in the $112–$117 range.
Disclaimer: For information purposes only. Past performance is not indicative of future results.
placeholder
【Daily Brief】10-year Treasury yield briefly tops 5%, S&P 500 slips to 7,602 and the dollar firms at 99.3 as the Fed's decision eve beginsThe 10-year Treasury yield touched 5.014% on Monday — its first print above 5% since October 2023 — while the S&P 500 closed 0.48% lower at 7,619.98 and the dollar index firmed to 99.3. Here is the full market wrap ahead of Wednesday's FOMC decision, the dot plot and the August retail sales report, plus today's CLARITY Act Senate vote.
Author  Irene Q.
Sep 15, Tue
The 10-year Treasury yield touched 5.014% on Monday — its first print above 5% since October 2023 — while the S&P 500 closed 0.48% lower at 7,619.98 and the dollar index firmed to 99.3. Here is the full market wrap ahead of Wednesday's FOMC decision, the dot plot and the August retail sales report, plus today's CLARITY Act Senate vote.
placeholder
October hike odds climb toward 60% as Goldman and BofA both flip — what Warsh's "dose of accommodation" really changedRate futures now price roughly 55% to 62% for a 25bp hike at the October 27-28 FOMC, up from about 30% before Chair Warsh's post-meeting framing that the Fed is merely "removing some accommodation." Goldman Sachs has added an October hike to its forecast and Bank of America now sees moves in both October and December. Here is the repricing, the language behind it, and the two data points that decide it.
Author  Irene Q.
Sep 23, Wed
Rate futures now price roughly 55% to 62% for a 25bp hike at the October 27-28 FOMC, up from about 30% before Chair Warsh's post-meeting framing that the Fed is merely "removing some accommodation." Goldman Sachs has added an October hike to its forecast and Bank of America now sees moves in both October and December. Here is the repricing, the language behind it, and the two data points that decide it.
placeholder
Four jobs reports in five days: what JOLTS, ADP, claims and the September payrolls mean for the October Fed decisionThe US labour market faces its densest data week of the month. JOLTS job openings land Tuesday (7.2 million expected), ADP on Wednesday (70,000 expected), initial claims on Thursday and the September non-farm payrolls on Friday (100,000 expected, down from 162,000). Markets price a 64%-70% chance of another quarter-point Fed hike on October 28. The dollar index sits at 100.77 and the S&P 500 at 7,729.8.
Author  Mitrade
Sep 28, Mon
The US labour market faces its densest data week of the month. JOLTS job openings land Tuesday (7.2 million expected), ADP on Wednesday (70,000 expected), initial claims on Thursday and the September non-farm payrolls on Friday (100,000 expected, down from 162,000). Markets price a 64%-70% chance of another quarter-point Fed hike on October 28. The dollar index sits at 100.77 and the S&P 500 at 7,729.8.
placeholder
Nvidia's $150 billion buyback landed — and the AI sector fell anyway. That's the signal worth tradingNvidia closed up 1.68% at $228.86 on 28 September after announcing a $150 billion share repurchase authorisation, the largest single corporate buyback on record, while the rest of the AI complex sold off: AMD -3.6%, Micron -2.6%, Meta -4.8% and the Philadelphia Semiconductor Index -1.61%. The divergence is not noise. Capital is rotating toward cash-flow certainty, not abandoning the AI theme. With Micron reporting after the close on 30 September, here is what the split means.
Author  Irene Q.
21 hours ago
Nvidia closed up 1.68% at $228.86 on 28 September after announcing a $150 billion share repurchase authorisation, the largest single corporate buyback on record, while the rest of the AI complex sold off: AMD -3.6%, Micron -2.6%, Meta -4.8% and the Philadelphia Semiconductor Index -1.61%. The divergence is not noise. Capital is rotating toward cash-flow certainty, not abandoning the AI theme. With Micron reporting after the close on 30 September, here is what the split means.
placeholder
The 30-year Treasury just hit a 22-year high — and the bond market is not pricing the Fed, it is pricing the deficitThe 30-year Treasury yield closed at 5.56% on 28 September, the highest since June 2004, while the 10-year reached 5.24% and the 20-year 5.60%. The curve has steepened roughly 30bp in eight sessions even as October hike odds sit at 70.3%. That gap is the story: the long end is repricing fiscal and inflation risk, not policy. With PCE on Wednesday and payrolls on Friday, here is what the long end is really saying.
Author  Irene Q.
20 hours ago
The 30-year Treasury yield closed at 5.56% on 28 September, the highest since June 2004, while the 10-year reached 5.24% and the 20-year 5.60%. The curve has steepened roughly 30bp in eight sessions even as October hike odds sit at 70.3%. That gap is the story: the long end is repricing fiscal and inflation risk, not policy. With PCE on Wednesday and payrolls on Friday, here is what the long end is really saying.
goTop
quote