


Humana Inc Stock (HUM) Moved Up by 7.74% on Sep 25: A Full Analysis
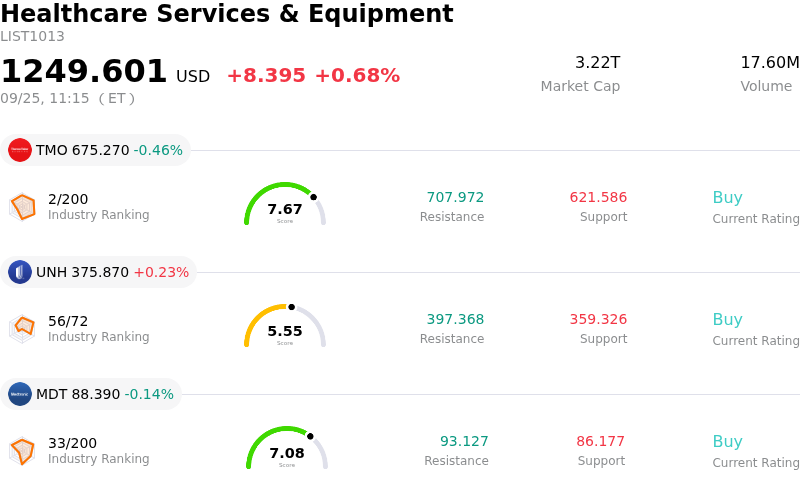
Humana Inc (HUM) moved up by 7.74%. The Healthcare Services & Equipment sector is up by 0.68%. The company outperformed the industry. Top 3 stocks by turnover in the sector: Thermo Fisher Scientific Inc (TMO) down 0.46%; Unitedhealth Group Inc (UNH) up 0.31%; Medtronic PLC (MDT) down 0.14%.
What is driving Humana Inc (HUM)’s stock price up today?
Humana experienced significant upward momentum during today's trading session, largely driven by a high-profile analyst upgrade and heightened optimism surrounding the upcoming Centers for Medicare & Medicaid Services (CMS) Star Ratings release. Barclays elevated its rating on the healthcare insurer from Equal Weight to Overweight while substantially boosting its price target. The Wall Street firm cited growing confidence that a major Medicare Advantage contract covering approximately 2.4 million members has a high probability of securing bonus status for the upcoming rating cycle. An upgrade in star ratings would materially enhance federal quality bonus payments and improve multi-year revenue visibility, addressing one of the core headwinds that had previously pressured the company's margins.
Investor sentiment has also been bolstered by management's ongoing execution of its multi-year margin restoration strategy. Humana has been actively repositioning its portfolio by exiting lower-margin plans, instituting tighter bid discipline for its Medicare Advantage offerings, and focusing on member recapture into higher-value contracts. Simultaneously, the steady expansion of its CenterWell primary care and pharmacy services continues to diversify revenue streams and enhance overall patient retention. Management recently reaffirmed its full-year earnings guidance during investor meetings throughout September, providing market participants with added clarity and reinforcing confidence in the company's operational trajectory.
While near-term volatility remains present as the healthcare sector awaits official regulatory announcements, today's market reaction underscores a favorable shift in institutional positioning. The combination of bullish analyst revisions, improving regulatory clarity, and disciplined cost-control measures has positioned Humana as a key turnaround candidate within the managed care space. However, investors will closely monitor the final CMS publication in early October, as actual star rating results and medical utilization trends will serve as crucial validation points for the company's mid-term earnings trajectory.
Technical Analysis of Humana Inc (HUM)
Technically, Humana Inc (HUM) shows a MACD (12,26,9) value of -1.921, indicating a neutral signal. The RSI at 60.444 suggests neutral condition and the Williams %R at 24.017 suggests buy condition. Please monitor closely.
Fundamental Analysis of Humana Inc (HUM)
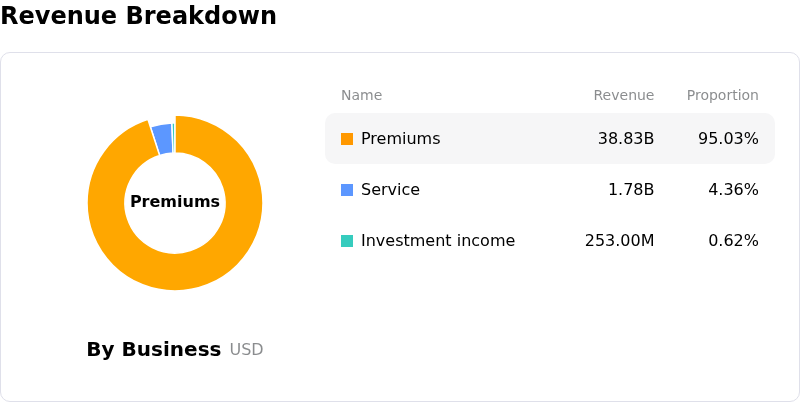
Humana Inc (HUM) is in the Healthcare Services & Equipment industry. Its latest annual revenue is $129.66B, ranking 6 in the industry. The net profit is $1.19B, ranking 8 in the industry. Company Profile
Over the past month, multiple analysts have rated the company as Buy, with an average price target of $416.32, a high of $513.00, and a low of $280.00.
More details about Humana Inc (HUM)
Company Specific Risks:
- Medicare Advantage Star Rating Degradation: A sharp decline in CMS Star Ratings across key contracts directly reduces federal quality bonus payments, creating severe operating margin compression and constraining full-year earnings capacity.
- Elevated Medical Cost Trends: Persistent, higher-than-expected healthcare utilization and elevated drug costs among senior enrollees weigh on the company's benefit ratio, threatening near-term margin recovery.
- Plan Resizing and Enrollment Churn Risks: Executing a strategic margin restoration plan that involves exiting underperforming plans with approximately 600,000 enrollees creates significant customer retention uncertainty and top-line execution headwinds.
- EBITDA Margin Compression and Credit Downgrades: Credit rating downgrades by rating agencies, driven by persistent margin pressure and debt-to-EBITDA ratios hovering around 3.6x, raise long-term capital costs and restrict financial flexibility.
Recommended Articles


