


Allstate Corp Stock (ALL) Moved Down by 5.40% on Sep 22: Key Drivers Unveiled
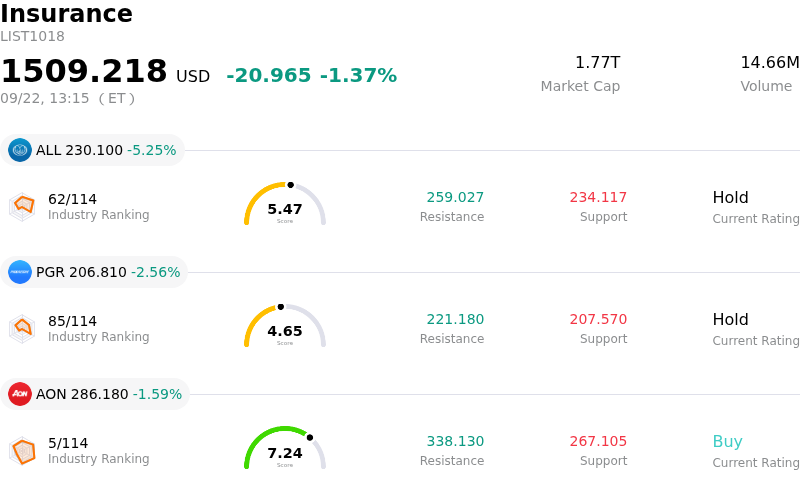
Allstate Corp (ALL) moved down by 5.40%. The Insurance sector is down by 1.37%. The company underperformed the industry. Top 3 stocks by turnover in the sector: Allstate Corp (ALL) down 5.25%; Progressive Corp (PGR) down 2.56%; Aon PLC (AON) down 1.59%.
What is driving Allstate Corp (ALL)’s stock price down today?
The primary driver behind the downward movement in Allstate Corporation stock stems from heightened investor sensitivity surrounding rising weather-related catastrophe losses. The company recently disclosed substantial monthly pre-tax catastrophe losses stemming from severe convective storms, wind, and hail events across multiple regions. This surge in severe weather claims has raised aggregate catastrophe losses for the current annual risk period to elevated levels, renewing concerns regarding geographic concentration risk. With the ongoing severe weather and hurricane season creating persistent uncertainty, market participants are reassessing whether escalating claim volumes will erode property and casualty underwriting margins for the quarter, dampening the positive impact of core premium growth.
Broad market positioning and sector rotation further amplified the selling pressure on the stock. Investors engaged in capital rotation away from defensive, value-heavy financial and insurance names and into high-beta growth and technology sectors. Following an extended rally supported by pricing discipline and statutory surplus recovery over prior quarters, Allstate experienced widespread profit-taking. Institutional portfolio adjustments away from defensive property and casualty insurers accelerated the stock's decline relative to the broader market, as funds reallocated capital toward momentum-driven segments.
From a technical and strategic perspective, the stock breached key short-term moving average support levels, triggering automated sell orders and systematic trend-following pressure. Although the insurer maintains solid capitalization, robust cash flow generation, and disciplined rate adjustments, cautious sentiment from sell-side analysts regarding weather volatility continues to limit near-term valuation expansion. Market participants remain focused on upcoming monthly catastrophe loss disclosures and reinsurance coverage thresholds to gauge whether core underwriting profitability can withstand elevated seasonal claims.
Technical Analysis of Allstate Corp (ALL)
Technically, Allstate Corp (ALL) shows a MACD (12,26,9) value of -4.891, indicating a sell signal. The RSI at 27.375 suggests sell condition and the Williams %R at 93.373 suggests oversold condition. Please monitor closely.
Media Coverage of Allstate Corp (ALL)
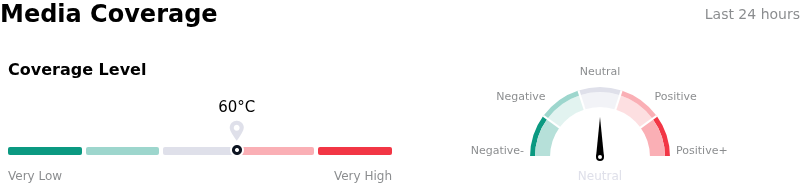
In terms of media coverage, Allstate Corp (ALL) shows a coverage score of 60, indicating a moderate level of media attention. The overall market sentiment index is currently in neutral zone.
Fundamental Analysis of Allstate Corp (ALL)
Allstate Corp (ALL) is in the Insurance industry. Its latest annual revenue is $67.69B, ranking 3 in the industry. The net profit is $10.16B, ranking 3 in the industry. Company Profile
Over the past month, multiple analysts have rated the company as Hold, with an average price target of $271.11, a high of $334.00, and a low of $131.33.
More details about Allstate Corp (ALL)
Company Specific Risks:
- Escalating Catastrophe Loss Burdens: Recent Form 8-K disclosures revealed August pre-tax catastrophe losses of $748 million across 21 weather events, bringing combined July and August pre-tax losses to $1.43 billion ($1.13 billion after-tax) and severely pressuring third-quarter underwriting margins.
- Intraday Price Shock and Capital Rotation: Shares dropped 5.19% to $230.26 during the September 22 trading session, sharply underperforming the broader equity market as institutional capital rotated out of defensive insurance holdings and triggered technical breakdown signals below key moving averages.
- Analyst Headwinds on Earnings Projections: Institutional analyst commentary highlights severe risk to upcoming quarterly earnings, with consensus projections pointing to a year-over-year earnings per share decline exceeding 40% due to the heavy summer catastrophe burden.
- Regulatory Rate Resistance and Claim Severity: Persistent inflation in home repair and auto replacement costs continues to elevate claims severity, while regulatory delays in securing necessary state-level rate increases threaten the sustainability of underwriting margins.
Recommended Articles


