

Ethereum (ETHUSD) Is up 7.28% on Sep 19: Why It Happened

Source Tradingkey

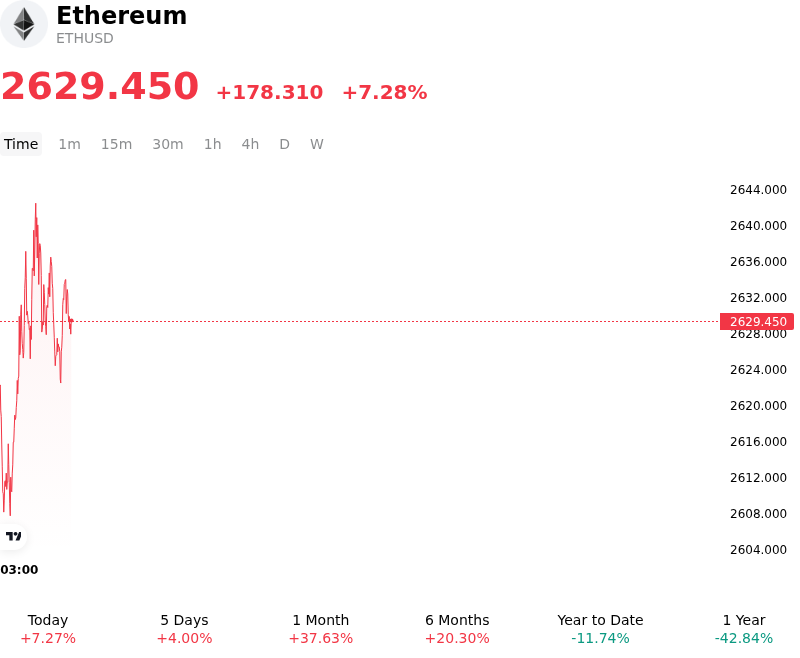
Ethereum (ETHUSD) is up 7.28% at Sep 19 20:25(ET), now at $2629.45, with a 7-day up of 4.41%.
SummaryOverview

What is driving Ethereum (ETHUSD)’s stock price up today?

Capital expanded into Ethereum as digital asset markets staged a broad risk-on recovery, absorbing recent monetary policy updates from major central banks. The ability of digital assets to weather recent interest rate adjustments and hawkish guidance indicated that tighter monetary conditions were largely discounted by institutional participants. As macroeconomic headwinds temporarily abated, investor appetite for key smart contract platforms strengthened, prompting a rapid pivot from defensive positioning toward spot accumulation.

Network fundamentals provided a strong operational backstop, highlighted by expanding Layer-2 execution capacity and reduced transaction overhead. Structural enhancements to block space efficiency, including expanded blob throughput and Layer-2 scaling solutions, have significantly lowered transaction execution costs. Institutional allocators interpreted these execution cost reductions as a constructive catalyst for long-term network utilization, decentralised finance activity, and broader ecosystem throughput.

Derivatives market positioning played a central role in accelerating intraday momentum. Ethereum's decisive break above key technical resistance levels triggered a series of buy-stops and short-position liquidations across major perpetual futures venues. Systematic trend-following strategies and market makers were forced to execute dynamic delta-hedging orders to rebalance directional exposure, compounding spot buying pressure and rapidly lifting prices through thin liquidity pockets.

Institutional interest in digital asset investment products and corporate treasury vehicles showed renewed resilience, reflecting broader capital deployment back into leading Layer-1 assets. While market participants continue to monitor global yield curves, interest rate trajectories, and regulatory developments, the combination of short covering, improved network efficiency, and stabilizing spot flows generated a powerful bullish impulse across the market.

Technical Analysis of Ethereum (ETHUSD)

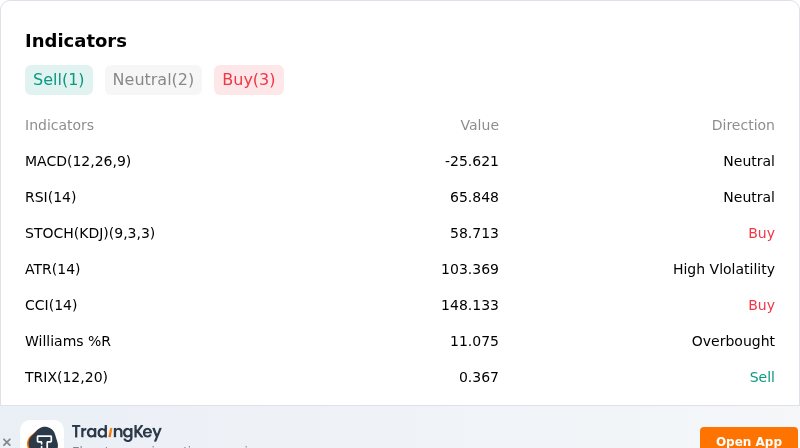
Technically, Ethereum (ETHUSD) shows a MACD (12,26,9) value of -25.621, indicating a neutral signal. The RSI at 65.848 suggests neutral condition and the Williams %R at 11.075 suggests overbought condition. Please monitor closely.
IndicatorAnalysis

More details about Ethereum (ETHUSD)

Recent Events and Risks:

  • Legislative Regulatory Setbacks: The failure of the CLARITY Act to pass a key U.S. Senate procedural vote introduced renewed regulatory ambiguity for stablecoin protocols and tokenized market structures, triggering sharp sell-offs and suppressing institutional risk appetite across Ethereum trading pairs.
  • Sustained Spot ETF Capital Outflows: Institutional demand for spot Ethereum ETFs remains deeply constrained, marked by multiple consecutive sessions of net redemptions exceeding $200 million, depriving the spot market of the sustained institutional bids required to break above key overhead resistance.
  • Derivatives Long Liquidation Cascades: Elevated open interest alongside recent derivative liquidations exceeding $200 million—heavily skewed toward bullish leveraged positions—creates an air-pocket risk for sharp intraday volatility if key technical support near $2,400 fails.
  • Macroeconomic Tightening and Yield Pressures: Macro headwinds, including elevated 10-year U.S. Treasury yields holding near 5.0% alongside hawkish Federal Reserve rate policy, continue to restrict broader market liquidity and weigh heavily on Ethereum's relative performance against Bitcoin.
Disclaimer: For information purposes only. Past performance is not indicative of future results.
placeholder
Fed hike odds near 90% into Wednesday's decision — how to trade the dollar, gold and the S&P 500A 0.3% monthly core CPI print has lifted the market-implied probability of a 25bp Fed hike on 16 September to roughly 86.5% ~ 90%, which would be the first increase since July 2023. Here is the decision timeline, the pricing versus the forecasts, both scenarios, and the key levels for the dollar, gold and the S&P 500.
Author  Suzie
Sep 14, Mon
A 0.3% monthly core CPI print has lifted the market-implied probability of a 25bp Fed hike on 16 September to roughly 86.5% ~ 90%, which would be the first increase since July 2023. Here is the decision timeline, the pricing versus the forecasts, both scenarios, and the key levels for the dollar, gold and the S&P 500.
placeholder
Silver breaks $64 as precious metals rebound — can gold hold the $4,280 line into the Fed decision?Silver has climbed back above $64 an ounce for the first time this week, leading a broad rebound across precious metals hours before the Federal Reserve delivers what is expected to be its first rate hike since 2023. Spot silver was last at $64.64, up 1.49% on the day, while gold reclaimed $4,300 and platinum and palladium both advanced. The question now is whether the bounce is a genuine turn — or a pause before the Fed's dot plot decides the next move.
Author  Suzie
Sep 16, Wed
Silver has climbed back above $64 an ounce for the first time this week, leading a broad rebound across precious metals hours before the Federal Reserve delivers what is expected to be its first rate hike since 2023. Spot silver was last at $64.64, up 1.49% on the day, while gold reclaimed $4,300 and platinum and palladium both advanced. The question now is whether the bounce is a genuine turn — or a pause before the Fed's dot plot decides the next move.
placeholder
Dollar index tops 100 for the first time since July as the Fed's hawkish dot plot sinks inThe U.S. dollar index broke back above 100 for the first time since 31 July after the Fed delivered its first rate hike since 2023, with the dot plot showing 16 of 18 officials expect at least one more increase this year. Here are the levels that matter for DXY, the currencies feeling it most, and what to watch next.
Author  Irene Q.
Sep 17, Thu
The U.S. dollar index broke back above 100 for the first time since 31 July after the Fed delivered its first rate hike since 2023, with the dot plot showing 16 of 18 officials expect at least one more increase this year. Here are the levels that matter for DXY, the currencies feeling it most, and what to watch next.
placeholder
Gold rebounds to near $4,350 on weaker US Dollar, falling oil pricesGold price (XAU/USD) rises to near $4,345 during the early Asian session on Friday. The precious metal rebounds from a six-week low amid falling oil prices and a weaker US Dollar (USD). Traders continue to assess the latest Federal Reserve (Fed) rate hike and policy cues.
Author  FXStreet
Yesterday 01: 32
Gold price (XAU/USD) rises to near $4,345 during the early Asian session on Friday. The precious metal rebounds from a six-week low amid falling oil prices and a weaker US Dollar (USD). Traders continue to assess the latest Federal Reserve (Fed) rate hike and policy cues.
placeholder
US to delay new "overcapacity" tariffs on China — what the pause means for trade, inflation and the dollarWashington is expected to hold off announcing new tariffs over Chinese "overcapacity" until after the 24 September summit, according to Bloomberg. The postponed plan would have added 7.5% to Chinese goods, taking second-term US tariffs to around 20%. Here is what is on the table, and what a deal versus no deal would mean for the yuan, Hong Kong equities and the dollar.
Author  Mitrade
20 hours ago
Washington is expected to hold off announcing new tariffs over Chinese "overcapacity" until after the 24 September summit, according to Bloomberg. The postponed plan would have added 7.5% to Chinese goods, taking second-term US tariffs to around 20%. Here is what is on the table, and what a deal versus no deal would mean for the yuan, Hong Kong equities and the dollar.
goTop
quote