

BNB (BNBUSD) Is up 1.10% on Sep 18: What Are the Risk Factors?

Source Tradingkey

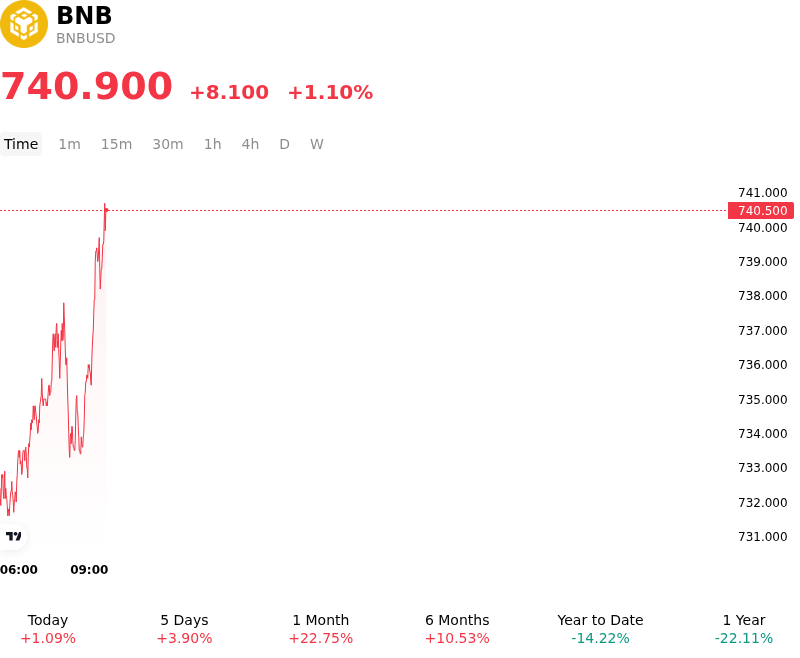
BNB (BNBUSD) is up 1.10% at Sep 18 21:35(ET), now at $740.9, with a 7-day up of 2.31%.
SummaryOverview

What is driving BNB (BNBUSD)’s stock price up today?

BNB advanced as positive ecosystem fundamentals and institutional adoption metrics bolstered buyer demand across spot and derivatives markets. A key catalyst driving structural optimism was the continued expansion of real-world asset protocols on BNB Chain, highlighted by the deployment of tokenized fixed-income products including U.S. Treasury bills and short-dated bonds. This expansion reinforced the network's growing footprint in institutional tokenization, particularly within tokenized traditional equities and debt instruments, driving on-chain capital inflows and sustaining utility-driven demand for the native token.

The positive price action was further supported by technical execution improvements following network protocol upgrades. The implementation of the Pasteur hard fork and the BidBlock V2 architecture enhanced block-building efficiency, significantly increasing transaction throughput while reducing execution latency. This structural throughput expansion reassured institutional market participants regarding the blockchain's capacity to scale high-frequency decentralized financial activity and tokenized asset settlement, encouraging capital deployment back into the ecosystem.

From a market structure perspective, the upward momentum reflected technical dip-buying near established support zones alongside disciplined derivatives positioning. Following broader market volatility linked to global monetary policy updates, major digital assets stabilized as investors absorbed central bank interest rate decisions. Futures open interest stabilized near recent highs, while liquidations of short positions provided additional upward pressure during intraday trading sessions.

Despite the constructive recovery, institutional investors continue to monitor macroeconomic liquidity conditions and evolving regulatory frameworks. Tighter global monetary policy, shifts in exchange trading volumes, and ongoing regulatory discussions surrounding market structure remain key risk factors that could influence risk appetite and capital allocation across Layer-1 assets.

Technical Analysis of BNB (BNBUSD)

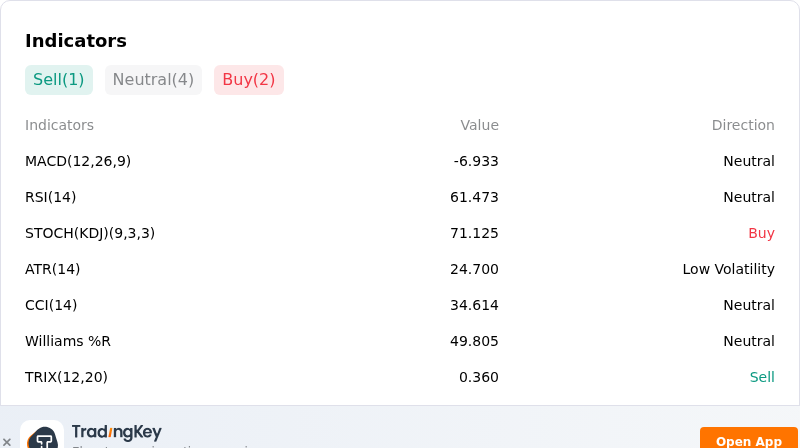
Technically, BNB (BNBUSD) shows a MACD (12,26,9) value of -6.933, indicating a neutral signal. The RSI at 61.473 suggests neutral condition and the Williams %R at 49.805 suggests neutral condition. Please monitor closely.
IndicatorAnalysis

More details about BNB (BNBUSD)

Recent Events and Risks:

  • Regulatory Legislative Setbacks and Compliance Scrutiny: The recent procedural failure of the U.S. CLARITY Act in the Senate has stalled comprehensive digital asset market structure legislation, renewing policy uncertainty for institutional market participants. This legislative setback, combined with persistent European MiCA regulatory scrutiny surrounding Binance's operational footprint, continues to constrain institutional capital allocation into BNB.
  • Technical Resistance Rejection and Bearish Signal Crossover: BNB faced strong overhead supply rejection after failing to sustain momentum near the $730–$750 resistance zone, prompting swift profit-taking. The resulting technical pullback pushed intraday momentum lower and printed a daily MACD bearish crossover, increasing the likelihood of a deeper drop toward key support levels.
  • Concentrated Long Liquidation Clusters and On-Chain Leverage: Derivatives and DeFi liquidation heatmaps show dense pockets of leveraged long positions clustered between $703 and $712. A decisive close below immediate support at $709 risks triggering automated liquidation cascades across perpetual futures and BNB Chain collateralized lending protocols, driving intraday slippage.
  • Macroeconomic De-risking and Open Interest Unwinding: Persistent interest rate uncertainty ahead of Federal Reserve monetary policy announcements has prompted crypto derivatives traders to aggressively reduce open interest and unwind leveraged long positions. This market-wide liquidity contraction and systemic risk-off sentiment leave high-beta altcoins like BNB vulnerable to sudden downside swings.
Disclaimer: For information purposes only. Past performance is not indicative of future results.
placeholder
Fed hike odds near 90% into Wednesday's decision — how to trade the dollar, gold and the S&P 500A 0.3% monthly core CPI print has lifted the market-implied probability of a 25bp Fed hike on 16 September to roughly 86.5% ~ 90%, which would be the first increase since July 2023. Here is the decision timeline, the pricing versus the forecasts, both scenarios, and the key levels for the dollar, gold and the S&P 500.
Author  Suzie
Sep 14, Mon
A 0.3% monthly core CPI print has lifted the market-implied probability of a 25bp Fed hike on 16 September to roughly 86.5% ~ 90%, which would be the first increase since July 2023. Here is the decision timeline, the pricing versus the forecasts, both scenarios, and the key levels for the dollar, gold and the S&P 500.
placeholder
Silver breaks $64 as precious metals rebound — can gold hold the $4,280 line into the Fed decision?Silver has climbed back above $64 an ounce for the first time this week, leading a broad rebound across precious metals hours before the Federal Reserve delivers what is expected to be its first rate hike since 2023. Spot silver was last at $64.64, up 1.49% on the day, while gold reclaimed $4,300 and platinum and palladium both advanced. The question now is whether the bounce is a genuine turn — or a pause before the Fed's dot plot decides the next move.
Author  Suzie
Sep 16, Wed
Silver has climbed back above $64 an ounce for the first time this week, leading a broad rebound across precious metals hours before the Federal Reserve delivers what is expected to be its first rate hike since 2023. Spot silver was last at $64.64, up 1.49% on the day, while gold reclaimed $4,300 and platinum and palladium both advanced. The question now is whether the bounce is a genuine turn — or a pause before the Fed's dot plot decides the next move.
placeholder
Bitcoin falls below $75,000 as the CLARITY Act fails in the Senate — what the vote means for cryptoThe US Senate blocked the Digital Asset Market CLARITY Act in a 49-50 procedural vote, sending Bitcoin briefly below $75,000 — its biggest one-day drop since June. Ethereum fell more than 8%, Coinbase slid 10% and $75 billion of crypto market value evaporated. Here is what the vote was, why it failed, and the levels that matter now.
Author  Suzie
Sep 16, Wed
The US Senate blocked the Digital Asset Market CLARITY Act in a 49-50 procedural vote, sending Bitcoin briefly below $75,000 — its biggest one-day drop since June. Ethereum fell more than 8%, Coinbase slid 10% and $75 billion of crypto market value evaporated. Here is what the vote was, why it failed, and the levels that matter now.
placeholder
Dow drops 631 points as the Fed hikes — but futures are rebounding: what's next for US stocks?The Dow fell 631 points and the S&P 500 closed below 7,600 after the Fed hiked rates for the first time since 2023, with the dot plot showing 16 of 18 officials expect more tightening. Asia-session futures are already recovering — here are the levels and analyst views that decide whether 7,500 holds.
Author  Irene Q.
Yesterday 02: 54
The Dow fell 631 points and the S&P 500 closed below 7,600 after the Fed hiked rates for the first time since 2023, with the dot plot showing 16 of 18 officials expect more tightening. Asia-session futures are already recovering — here are the levels and analyst views that decide whether 7,500 holds.
placeholder
Dollar index tops 100 for the first time since July as the Fed's hawkish dot plot sinks inThe U.S. dollar index broke back above 100 for the first time since 31 July after the Fed delivered its first rate hike since 2023, with the dot plot showing 16 of 18 officials expect at least one more increase this year. Here are the levels that matter for DXY, the currencies feeling it most, and what to watch next.
Author  Irene Q.
Yesterday 02: 45
The U.S. dollar index broke back above 100 for the first time since 31 July after the Fed delivered its first rate hike since 2023, with the dot plot showing 16 of 18 officials expect at least one more increase this year. Here are the levels that matter for DXY, the currencies feeling it most, and what to watch next.
goTop
quote