

USD/JPY (USDJPY) Volatility Intensified on Sep 17: Factors to Watch

Source Tradingkey

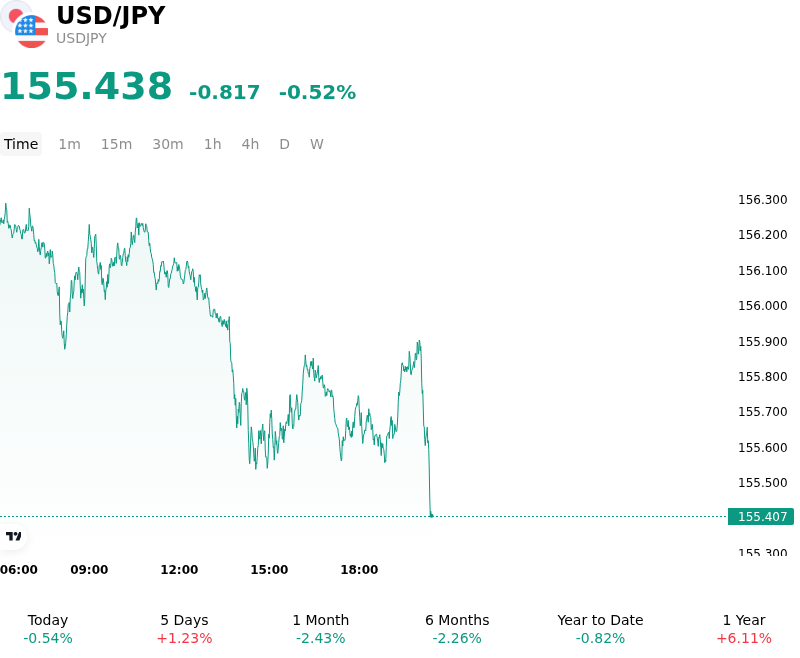
USD/JPY (USDJPY) is down 0.52% at Sep 17 08:25(ET), now at $155.438, with a 7-day up of 0.66%.
SummaryOverview

What is driving USD/JPY (USDJPY)’s stock price down today?

The pullback in USD/JPY was primarily driven by position-adjustment and heightened anticipation ahead of the Bank of Japan's upcoming policy decision. While the Federal Reserve delivered a quarter-point rate hike, the U.S. dollar's initial upside momentum faded as global market focus pivoted toward Tokyo. Investors increasingly priced in a high probability of a benchmark rate increase by the Bank of Japan, with expectations mounting that Japanese policymakers would raise interest rates and offer hawkish guidance regarding further policy normalization. The prospect of incremental policy convergence, alongside a desire among market participants to de-risk short-yen positions, provided solid underlying support for the Japanese yen.

Front-end rate differentials and institutional capital flows also favored the yen during the trading session. Japanese government bond yields hovered near multi-year highs, helping to narrow short-term U.S.-Japan interest rate spreads. Institutional traders leveraged the U.S. dollar's initial post-Fed rally as an opportunity to take profits and rebalance portfolios ahead of the central bank announcement and an upcoming multi-day holiday in Japan. Additionally, lingering inflationary pressures driven by imported energy costs reinforced market expectations that the Bank of Japan will remain on a gradual tightening trajectory, curbing appetite for broad dollar expansion against Japanese assets.

From a macro perspective, the downside move in USD/JPY reflects a temporary repricing of monetary policy risks rather than a complete shift in long-term structural trends. While the Federal Reserve continues to emphasize its focus on controlling inflation, near-term price action in USD/JPY remains firmly anchored to the tone set by Bank of Japan Governor Kazuo Ueda. Should Japanese monetary authorities signal an accelerated pace of policy tightening, the yen could attract further capital inflows. Conversely, if the central bank offers a cautious outlook on future rate adjustments, the sizable absolute interest-rate spread between the U.S. and Japan is likely to limit deep downside momentum for the currency pair.

Technical Analysis of USD/JPY (USDJPY)

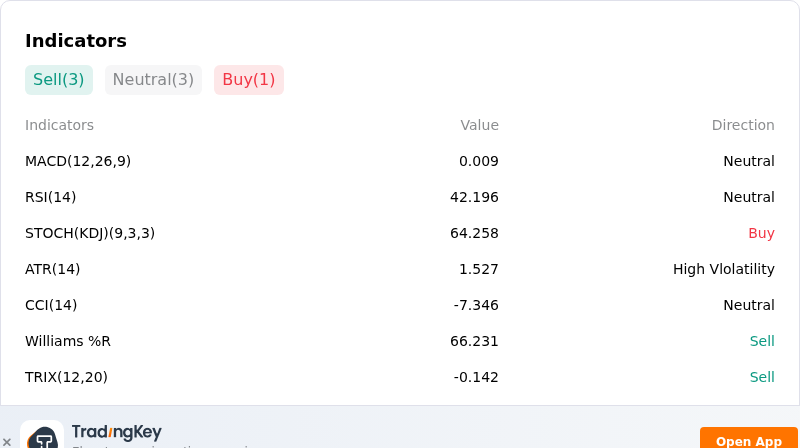
Technically, USD/JPY (USDJPY) shows a MACD (12,26,9) value of 0.009, indicating a neutral signal. The RSI at 42.196 suggests neutral condition and the Williams %R at 66.231 suggests sell condition. Please monitor closely.
IndicatorAnalysis

More details about USD/JPY (USDJPY)

Recent Events and Risks:

  • Bank of Japan Hawkish Policy Decision Risk: Expectations surrounding the Bank of Japan's upcoming rate decision and potential monetary policy tightening pose significant downside pressure on USDJPY through a rapid narrowing of US-Japan yield differentials.
  • Official Ministry of Finance FX Intervention Threats: Verbal intervention signals and potential coordinated yen-buying operations by Japanese monetary authorities around multi-month high resistance levels create constant downside volatility and flash-crash risks for USDJPY.
  • Yen Carry Trade Liquidation and Short Squeezes: Sharp repricing across the Japanese Government Bond yield curve and sudden unwinding of speculative yen short positions leave USDJPY highly vulnerable to rapid downside position adjustments during periods of risk aversion.
  • Japanese Inflation Surprises and Domestic Yield Spikes: Higher-than-anticipated domestic inflation metrics and elevated producer prices threaten to accelerate BOJ rate hike expectations, triggering immediate intraday selling in USDJPY.
Disclaimer: For information purposes only. Past performance is not indicative of future results.
placeholder
Fed hike odds near 90% into Wednesday's decision — how to trade the dollar, gold and the S&P 500A 0.3% monthly core CPI print has lifted the market-implied probability of a 25bp Fed hike on 16 September to roughly 86.5% ~ 90%, which would be the first increase since July 2023. Here is the decision timeline, the pricing versus the forecasts, both scenarios, and the key levels for the dollar, gold and the S&P 500.
Author  Suzie
Sep 14, Mon
A 0.3% monthly core CPI print has lifted the market-implied probability of a 25bp Fed hike on 16 September to roughly 86.5% ~ 90%, which would be the first increase since July 2023. Here is the decision timeline, the pricing versus the forecasts, both scenarios, and the key levels for the dollar, gold and the S&P 500.
placeholder
【Daily Brief】10-year Treasury yield briefly tops 5%, S&P 500 slips to 7,602 and the dollar firms at 99.3 as the Fed's decision eve beginsThe 10-year Treasury yield touched 5.014% on Monday — its first print above 5% since October 2023 — while the S&P 500 closed 0.48% lower at 7,619.98 and the dollar index firmed to 99.3. Here is the full market wrap ahead of Wednesday's FOMC decision, the dot plot and the August retail sales report, plus today's CLARITY Act Senate vote.
Author  Irene Q.
Sep 15, Tue
The 10-year Treasury yield touched 5.014% on Monday — its first print above 5% since October 2023 — while the S&P 500 closed 0.48% lower at 7,619.98 and the dollar index firmed to 99.3. Here is the full market wrap ahead of Wednesday's FOMC decision, the dot plot and the August retail sales report, plus today's CLARITY Act Senate vote.
placeholder
Silver breaks $64 as precious metals rebound — can gold hold the $4,280 line into the Fed decision?Silver has climbed back above $64 an ounce for the first time this week, leading a broad rebound across precious metals hours before the Federal Reserve delivers what is expected to be its first rate hike since 2023. Spot silver was last at $64.64, up 1.49% on the day, while gold reclaimed $4,300 and platinum and palladium both advanced. The question now is whether the bounce is a genuine turn — or a pause before the Fed's dot plot decides the next move.
Author  Suzie
Yesterday 08: 40
Silver has climbed back above $64 an ounce for the first time this week, leading a broad rebound across precious metals hours before the Federal Reserve delivers what is expected to be its first rate hike since 2023. Spot silver was last at $64.64, up 1.49% on the day, while gold reclaimed $4,300 and platinum and palladium both advanced. The question now is whether the bounce is a genuine turn — or a pause before the Fed's dot plot decides the next move.
placeholder
Dow drops 631 points as the Fed hikes — but futures are rebounding: what's next for US stocks?The Dow fell 631 points and the S&P 500 closed below 7,600 after the Fed hiked rates for the first time since 2023, with the dot plot showing 16 of 18 officials expect more tightening. Asia-session futures are already recovering — here are the levels and analyst views that decide whether 7,500 holds.
Author  Irene Q.
10 hours ago
The Dow fell 631 points and the S&P 500 closed below 7,600 after the Fed hiked rates for the first time since 2023, with the dot plot showing 16 of 18 officials expect more tightening. Asia-session futures are already recovering — here are the levels and analyst views that decide whether 7,500 holds.
placeholder
Dollar index tops 100 for the first time since July as the Fed's hawkish dot plot sinks inThe U.S. dollar index broke back above 100 for the first time since 31 July after the Fed delivered its first rate hike since 2023, with the dot plot showing 16 of 18 officials expect at least one more increase this year. Here are the levels that matter for DXY, the currencies feeling it most, and what to watch next.
Author  Irene Q.
10 hours ago
The U.S. dollar index broke back above 100 for the first time since 31 July after the Fed delivered its first rate hike since 2023, with the dot plot showing 16 of 18 officials expect at least one more increase this year. Here are the levels that matter for DXY, the currencies feeling it most, and what to watch next.
goTop
quote