


Solana (SOLUSD) Is up 1.03% on Aug 12: Here Is Why
Solana (SOLUSD) is up 1.03% at Aug 12 06:15(ET), now at $75.82, with a 7-day up of 3.33%.
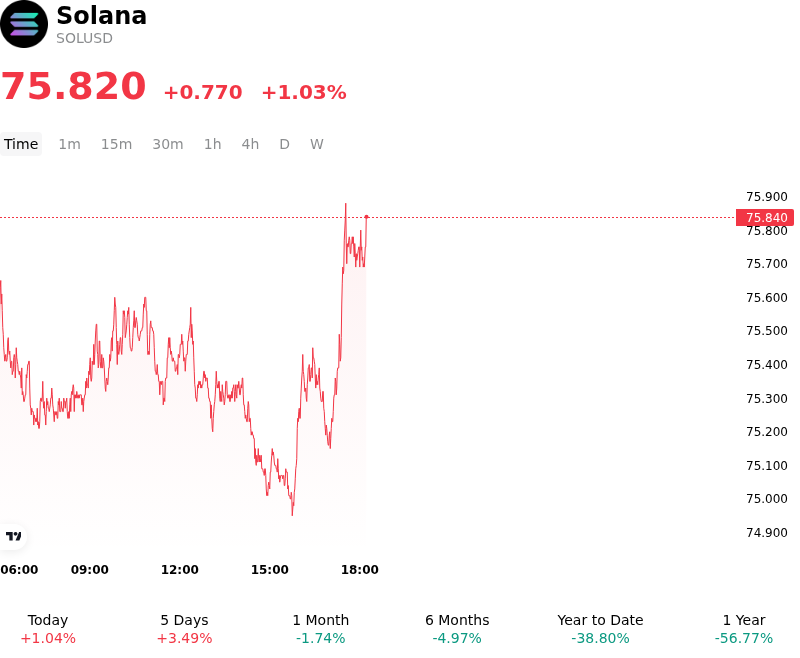
What is driving Solana (SOLUSD)’s stock price up today?
Solana advanced as fundamental adoption milestones and tightening tokenomic expectations catalyzed renewed spot buying interest and improved market sentiment. A primary driver of the move was the official rollout of MoneyGram Ramps on the network, providing developers with a unified application programming interface for compliant global cash-to-crypto and crypto-to-cash conversions. By streamlining fiat onboarding across extensive international retail banking channels, the integration enhanced expectations for real-world payment scaling and network utility. Sentiment was further bolstered by market discussion surrounding a validator-led governance proposal designed to substantially increase daily token burn rates, strengthening the asset's underlying supply-demand dynamics.
Institutional demand provided a stabilizing foundation for capital inflows. Sustained interest in spot Solana exchange-traded funds, which offer institutional investors direct exposure along with staking yield pass-throughs, served as a key capital sink. This institutional backstop, coupled with expanding enterprise payment partnerships, absorbed spot market supply and encouraged risk-on positioning. On-chain and derivatives data indicated a squeeze of localized short positions as spot prices breached key technical resistance at short-term exponential moving averages. The resulting technical breakout triggered momentum-based buying, flipping overhead resistance into immediate support and improving order-book liquidity.
The capital inflows reflect a structurally constructive shift within the layer-1 landscape, even as broader digital asset markets exercised caution ahead of macroeconomic data releases and shifting interest rate expectations. While near-term price action remains sensitive to broader market risk appetite, Treasury yield fluctuations, and macroeconomic liquidity conditions, the combination of enhanced fiat ramp infrastructure, institutional fund flows, and supply-reducing protocol proposals continues to strengthen Solana's competitive positioning and long-term adoption trajectory.
Technical Analysis of Solana (SOLUSD)
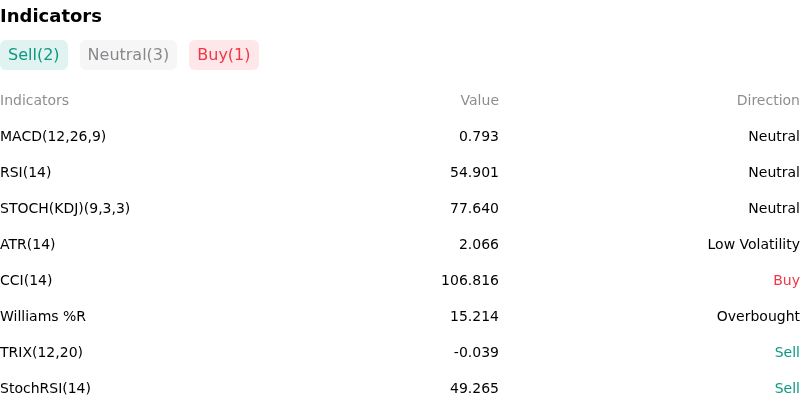
Technically, Solana (SOLUSD) shows a MACD (12,26,9) value of 0.793, indicating a neutral signal. The RSI at 54.901 suggests neutral condition and the Williams %R at 15.214 suggests overbought condition. Please monitor closely.
More details about Solana (SOLUSD)
Recent Events and Risks:
- Heavy Long Deleveraging and Whale Exits: Derivatives markets have seen sharp long-biased liquidation flushes alongside prominent exchange whales liquidating bullish positions, leaving key support levels around $70–$74 vulnerable to further downside pressure if leverage unwinds continue.
- FTX Bankruptcy Estate Supply Overhang: On-chain monitoring continues to track periodic transfers of SOL from FTX and Alameda bankruptcy estate wallets to centralized institutional venues, creating a lingering sell-side overhang as tokens are liquidated for creditor distributions.
- Muted Spot Demand and ETF Flow Inconsistency: Recent sentiment shifts marked by spot Solana ETF net outflows and cooling decentralized exchange volumes have weakened institutional bid support, reducing local order-book depth and increasing intraday price sensitivity.
- Macro Headwinds and Risk-Off Asset Pressure: Rising U.S. Treasury yields, sticky inflation concerns, and broader crypto market pullbacks continue to restrict speculative risk appetite, limiting upside momentum and dragging altcoin valuations lower.
Recommended Articles


