

Goldman Sachs Group Inc Stock (GS) Moved Down by 3.62% on Jun 5: Key Drivers Unveiled
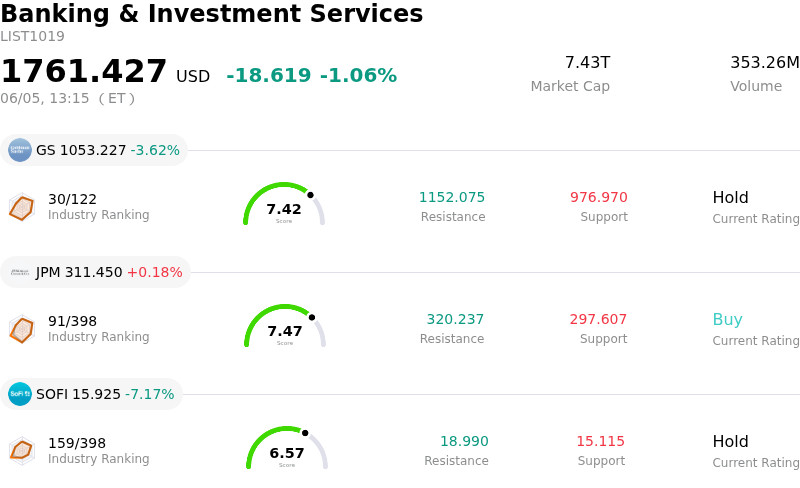
Goldman Sachs Group Inc (GS) moved down by 3.62%. The Banking & Investment Services sector is down by 1.06%. The company underperformed the industry. Top 3 stocks by turnover in the sector: Goldman Sachs Group Inc (GS) down 3.62%; JPMorgan Chase & Co (JPM) up 0.18%; SoFi Technologies Inc (SOFI) down 7.17%.
What is driving Goldman Sachs Group Inc (GS)’s stock price down today?
The downward movement in Goldman Sachs's share price today appears to be primarily driven by a broader negative reaction in the market to stronger-than-expected macroeconomic data. Reports indicated that US jobs growth significantly surpassed forecasts, with the unemployment rate remaining stable. This positive economic news paradoxically fueled speculation among investors that the Federal Reserve would be more inclined to pursue further interest rate hikes, leading to a "good news is bad news" scenario for equities.
This shift in macroeconomic outlook led to a decline across the wider stock market, with major indices experiencing drops as bond yields rose and traders fully priced in the likelihood of a rate increase by year-end. Financial stocks, including Goldman Sachs, are particularly sensitive to interest rate expectations and broader market sentiment, making them susceptible to such movements.
Additionally, ongoing discussions regarding potential risks within the financial sector, specifically concerning the concentration risk associated with AI debt and credit default swaps, and potential regulatory gaps, may also contribute to investor caution regarding major financial institutions. While Goldman Sachs recently announced the retirement of a co-chairman in India and engaged in debt offerings, these events are less likely to be the primary drivers of today's significant intraday downturn compared to the overarching macroeconomic concerns and market-wide sell-off.
Technical Analysis of Goldman Sachs Group Inc (GS)
Technically, Goldman Sachs Group Inc (GS) shows a MACD (12,26,9) value of [29.00], indicating a buy signal. The RSI at 74.93 suggests buy condition and the Williams %R at -1.91 suggests oversold condition. Please monitor closely.
Media Coverage of Goldman Sachs Group Inc (GS)
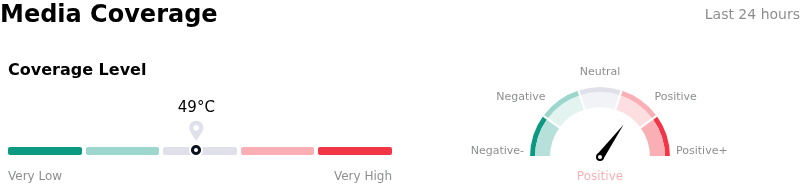
In terms of media coverage, Goldman Sachs Group Inc (GS) shows a coverage score of 49, indicating a moderate level of media attention. The overall market sentiment index is currently in bullish zone.
Fundamental Analysis of Goldman Sachs Group Inc (GS)
Goldman Sachs Group Inc (GS) is in the Banking & Investment Services industry. Its latest annual revenue is $117.10B, ranking 2 in the industry. The net profit is $16.30B, ranking 1 in the industry. Company Profile
Over the past month, multiple analysts have rated the company as Hold, with an average price target of $963.47, a high of $1050.00, and a low of $765.00.
More details about Goldman Sachs Group Inc (GS)
Company Specific Risks:
- Potential for near-term profitability challenges driven by a rising expense base and the necessity for elevated provisions amidst a volatile macroeconomic environment.
- High susceptibility to external market vulnerabilities, including heightened speculative activity, a deteriorating economic backdrop with rising interest rates, and geopolitical tensions, which threaten to compress corporate margins and reduce consumer spending, directly impacting core businesses.
- Significant exposure to international economic volatility and geopolitical uncertainties due to a considerable dependence on overseas revenues.
- Uncertainty surrounding Federal Reserve interest rate policy, with the firm's COO indicating persistent inflation may delay rate cuts, potentially hindering capital markets activity and deal flow crucial for investment banking revenue.
Recommended Articles


