

US yields rocket as stellar NFP sparks Fed hike bets
- US 2-year yield jumps as traders price tighter Fed policy.
- Blowout NFP gives Fed hawks fresh ammunition to fight inflation.
- US Dollar Index breaks 100 as December hike odds climb sharply.
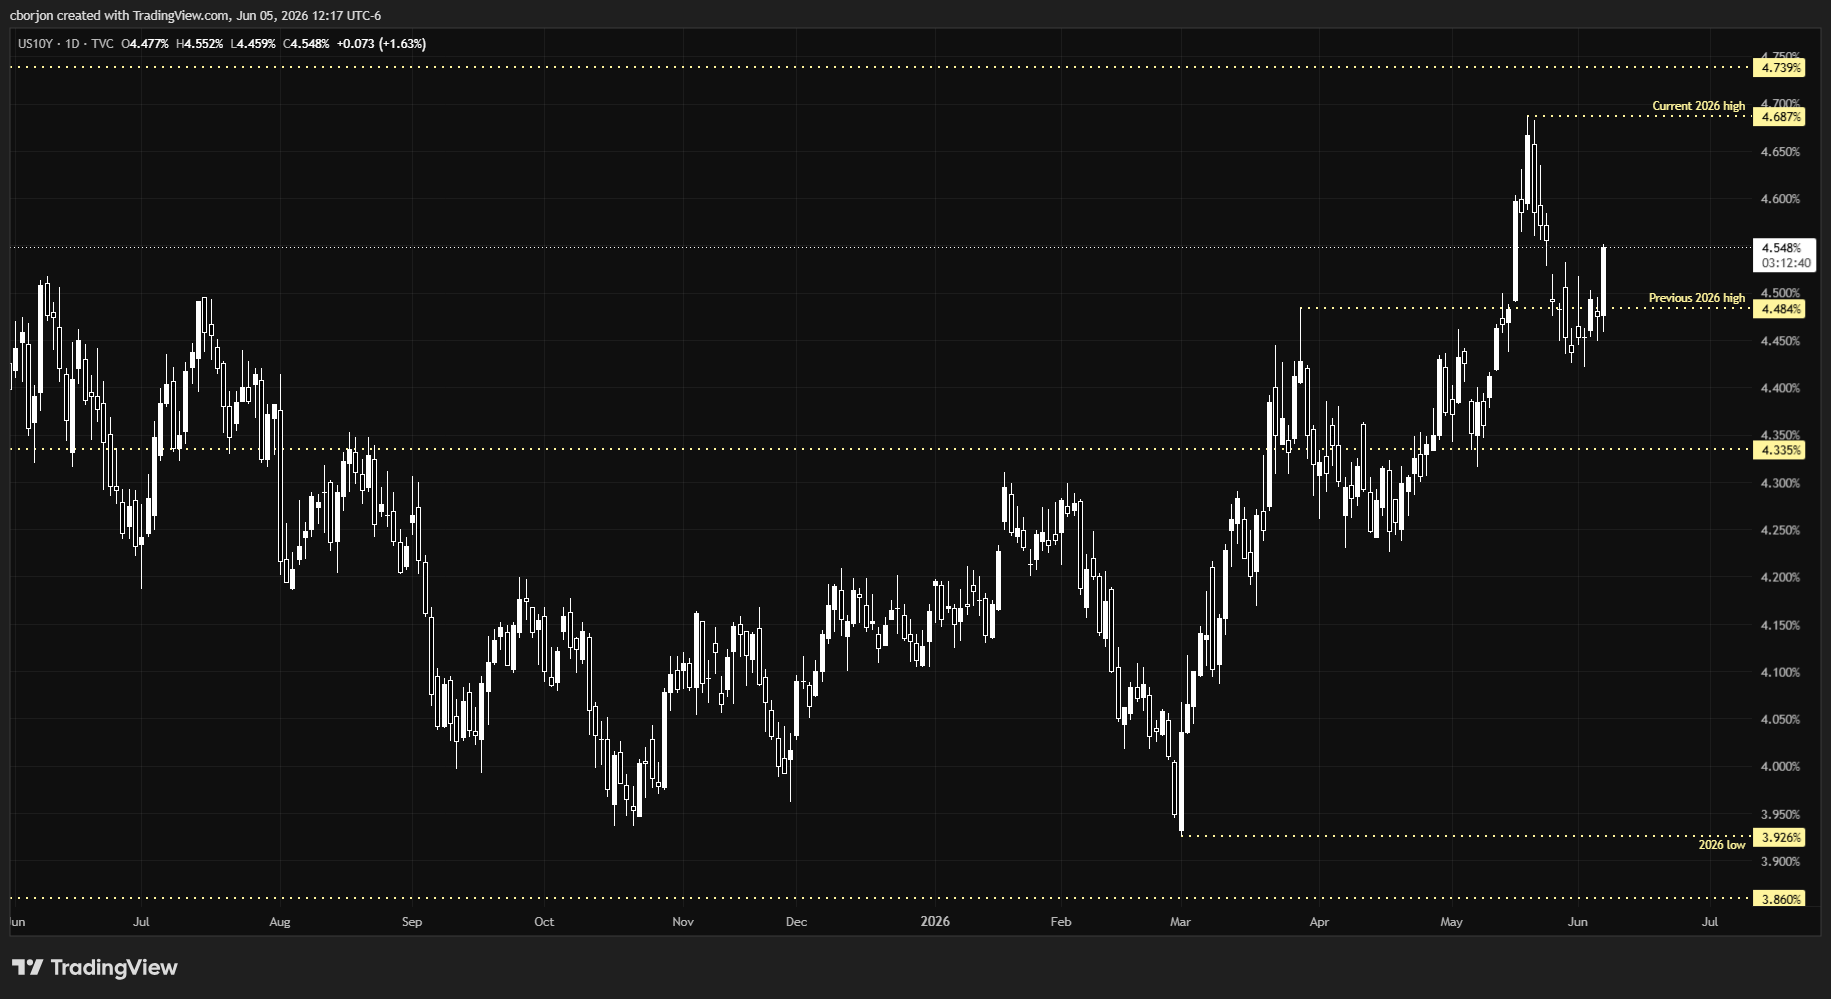
US Treasury yields skyrocket across the whole curve on Friday, with the 2-year Treasury note yield rising over twelve basis points, while the benchmark note, the 10-year, surges six basis points following an outstanding Nonfarm Payrolls report.
Treasury yields surge after payrolls crush forecasts, lifting Dollar
At the time of writing, the US 2-year Treasury note yields 4.162%, while the 10-year yield is at 4.538%. This signals that traders are expecting the Federal Reserve to raise interest rates, spurred by high US inflation, as the latest Consumer Price Index (CPI) report showed prices rose by 3.8% in April.
The stellar May’s Nonfarm Payrolls revealed the strength of the labour market with the economy adding 172,000 people to the workforce, above estimates of 85,000. Also, the Unemployment Rate steadied at 4.3% for the third consecutive month, providing sufficient ammunition for Federal Reserve hawks to discuss whether to tighten monetary policy this year, after easing policy by 75 basis points during the second half of 2025.
The Cleveland Fed President Beth Hammack—the most hawkish member of the Fed and a voter in 2026—stated that it is “reasonable to keep rates steady for now, but if recent trades persist, it might soon be necessary to act against high inflation.”
Based on Prime Terminal data, there is a 67% chance the Federal Reserve will hike rates in December, but it has fully priced in a 25 bps increase for early 2027.
The US Dollar Index (DXY), which measures the buck's value against six currencies, jumps by 0.67% to 100.09 after bouncing from daily lows around 99.15.
In the meantime, the US financial markets' five-year inflation expectations are at 2.48%, down from 2.53% a day ago, according to the 5-year Breakeven Inflation Rate. For 10 years, the 10-year Breakeven rate fell from 2.38% to 2.36%, suggesting markets expect medium-term inflation to decline.
Upcoming US economic events for next week
The US docket will include inflation reports for both consumer and producer prices, along with jobless claims data. Worth noting that Federal Reserve officials would be in blackout period ahead of the June 16-17 meeting, the first led by the new Fed Chair, Kevin Warsh.
US 10-year Treasury note yield
Interest rates FAQs
Interest rates are charged by financial institutions on loans to borrowers and are paid as interest to savers and depositors. They are influenced by base lending rates, which are set by central banks in response to changes in the economy. Central banks normally have a mandate to ensure price stability, which in most cases means targeting a core inflation rate of around 2%. If inflation falls below target the central bank may cut base lending rates, with a view to stimulating lending and boosting the economy. If inflation rises substantially above 2% it normally results in the central bank raising base lending rates in an attempt to lower inflation.
Higher interest rates generally help strengthen a country’s currency as they make it a more attractive place for global investors to park their money.
Higher interest rates overall weigh on the price of Gold because they increase the opportunity cost of holding Gold instead of investing in an interest-bearing asset or placing cash in the bank. If interest rates are high that usually pushes up the price of the US Dollar (USD), and since Gold is priced in Dollars, this has the effect of lowering the price of Gold.
The Fed funds rate is the overnight rate at which US banks lend to each other. It is the oft-quoted headline rate set by the Federal Reserve at its FOMC meetings. It is set as a range, for example 4.75%-5.00%, though the upper limit (in that case 5.00%) is the quoted figure. Market expectations for future Fed funds rate are tracked by the CME FedWatch tool, which shapes how many financial markets behave in anticipation of future Federal Reserve monetary policy decisions.
Recommended Articles


