

EUR/USD Price Analysis: Remains above 1.0750, descending channel pattern

- Gold Price Forecast: Gold Poised to Break $4,200 as Oil Price Slump Eases Inflation Fears
- Gold declines despite easing concerns over inflation, interest rate hikes
- Fed Decision Eve: 104 Economists Expect No Change; Why Is Citadel Securities Betting on a Surprise Hike?
- Gold Price Forecast: Can Gold Hold $4,020 as Fed Rate Hike Expectations Rise?
- Middle East War updates: US-Iran pause strikes as Trump weighs up diplomatic options
- WTI Oil flirts with the $80 level amid speculation about US-Iran peace talks

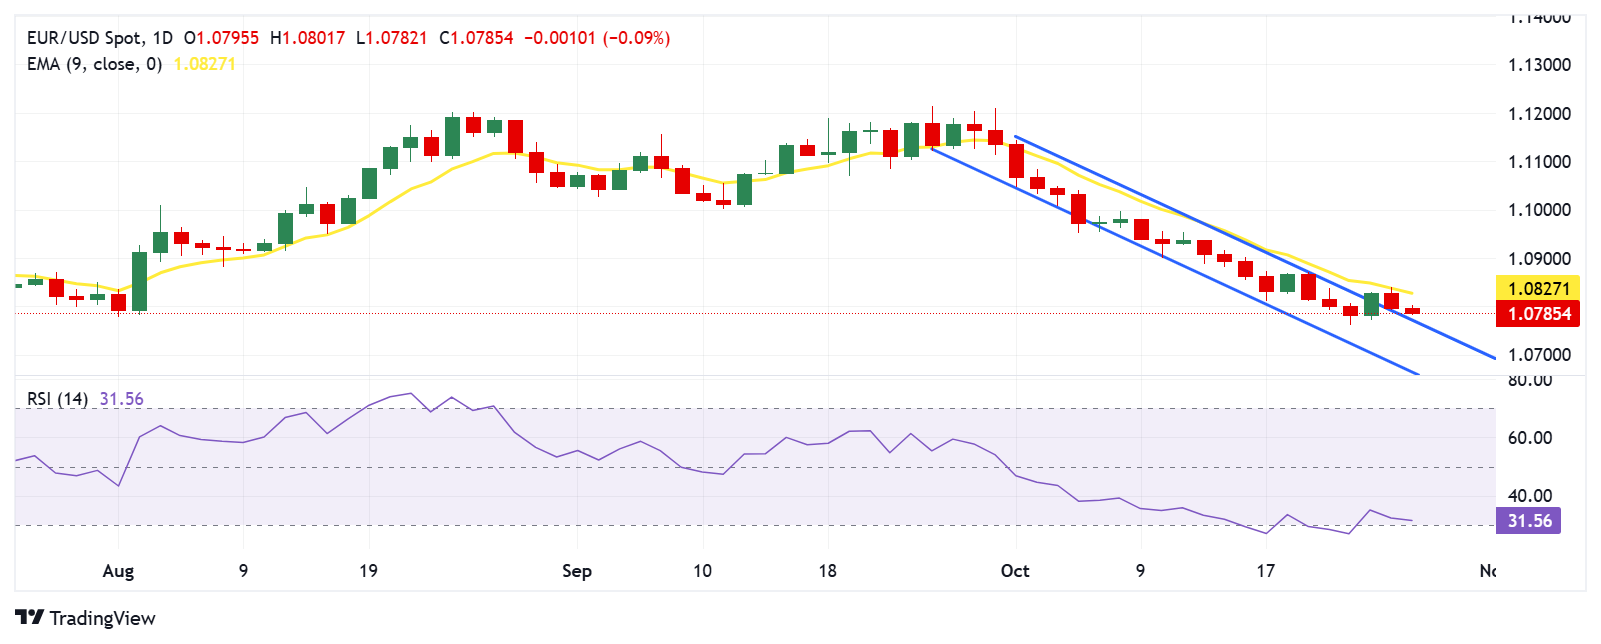
EUR/USD tests the upper boundary to re-enter the descending channel pattern.
If the 14-day RSI falls below the 30 level, it would signal an oversold condition.
A return to the descending channel could lead the pair to navigate the region around channel’s lower boundary at 1.0670.
EUR/USD inches lower for the second successive day, trading around 1.0780 during the Asian session on Monday. A review of the daily chart shows that the pair tests the upper boundary to return to the descending channel pattern. which could reinforce a bearish bias for the pair.
The 14-day Relative Strength Index (RSI), a key momentum indicator, is slightly above the 30 level. A drop below this threshold would indicate an oversold condition, suggesting the possibility of an upward correction for the EUR/USD pair in the near future.
On the downside, the immediate support appears at the upper boundary of the descending channel at 1.0770 level. A return to the descending channel could put pressure on the pair to navigate the region around the psychological level of 1.0600.
A break below the psychological level of 1.0600 could increase selling pressure, pushing the pair toward testing the lower boundary of the descending channel around the 1.0670 mark.
In terms of resistance, the EUR/USD pair may encounter an immediate barrier around the nine-day Exponential Moving Average (EMA) at 1.0826, followed by the psychological level of 1.0900.
EUR/USD: Daily Chart
Read more
* The content presented above, whether from a third party or not, is considered as general advice only. This article should not be construed as containing investment advice, investment recommendations, an offer of or solicitation for any transactions in financial instruments.


