


Gold price retreats as US yields rise, ahead of Nonfarm Payrolls


Gold price drops amid rising US Treasury yields diminish its appeal amidst uncertain Fed actions.
Mixed US jobless claims data contribute to market volatility ahead of crucial Nonfarm Payrolls release.
Fed Chair Powell's optimistic economic assessment tempers expectations for imminent rate cuts.
Gold price retreats on Thursday as investors digested the latest US jobless claim data, ahead of the release of November’s Nonfarm Payrolls figures. A jump in US Treasury bond yields weighed on the yellow metal, which dropped 0.85%, trading at $2,626.
XAU/USD dips as US Treasury bond yields rise while traders trim bets that the US Federal Reserve will lower borrowing costs by 25 basis points (bps) at the upcoming December meeting. Nevertheless, the mixed US jobs data revealed during the week kept investors uncertain about the outcome of the Fed’s decision.
Earlier, the US Department of Labor revealed that jobless claims for the last week exceeded the consensus, and the week ending on November 23 figures. At the same time, the US Bureau of Economic Analysis announced that the US trade deficit narrowed in October.
Bullion prices were capped by Fed Chair Jerome Powell’s comments on Wednesday. He said the economy remains robust, adding that he feels “very good about where the economy is and where monetary policy is.” Powell commented that the central bank “can afford to be a little more cautious as we try to find neutral.”
According to CME FedWatch Tool data, expectations that the Fed would cut rates at the December 17-18 meeting remain at 70%. However, Fed policymakers remained muted in their support for further easing, as next week’s inflation data would provide additional hints on the status of the distillation process.
Traders eye the release of November’s Nonfarm Payroll figures alongside the University of Michigan Consumer Sentiment.
Daily digest market movers: Gold price drops despite soft Initial Jobless Claims data
Gold prices advanced as US real yields rose one basis point to 1.91%.
The US 10-year Treasury bond yield is up one basis point to 4.18%.
The US Dollar Index (DXY), which tracks the buck's performance against six currencies, stumbles 0.51% to 105.80 on the day.
Initial Jobless Claims in the US increased by 9K to 224K for the week ending November 30, surpassing expectations of 215K, with the 4-week moving average climbing to 218.3K.
The US trade deficit narrowed sharply in October to $73.8 billion, down from $83.8 billion in September, according to the Bureau of Economic Analysis.
Data from the Chicago Board of Trade, via the December fed funds rate futures contract, shows investors estimate 19 bps of Fed easing by the end of 2024.
Fed speakers crossed the newswires. St. Louis Fed President Alberto Musalem said that time might be near to slow or pause rate cuts. Richmond Fed’s Thomas Barkin said that risks for inflation and maximum employment remain balanced.
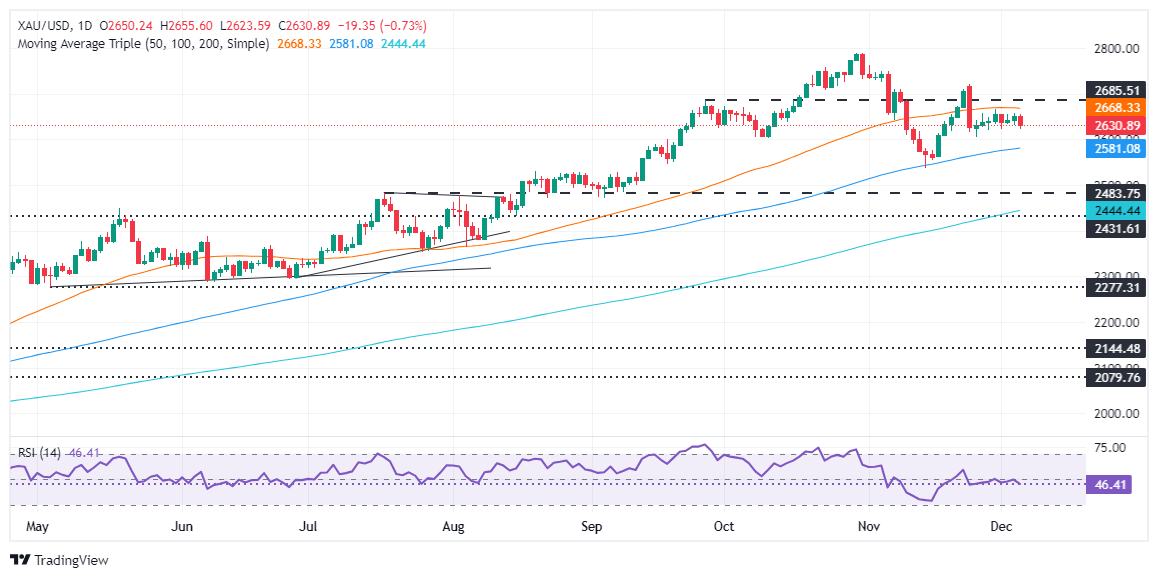
Technical outlook: Gold price consolidates within $2,600, and the 50-day SMA
Gold price remains consolidated after failing to register successive series of higher highs and lower lows, capped by the 50-day Simple Moving Average (SMA) at $2,667 on the upside. On the downside, XAU/USD failed to drop below the $2,620 figure, which could expose the $2,600 figure once cleared.
Momentum suggests that sellers are gathering some steam, as depicted by the recently turned bearish Relative Strength Index (RSI).
With that said, if XAU/USD slumps below $2,600, it will expose the confluence of an upslope support trendline and the 100-day Simple Moving Average (SMA) at $2,580, followed by the November 14 daily low and intermediate support at $2,536.
Conversely, if Gold reclaims $2,650, the next resistance would be the 50-day SMA. Once cleared, the next resistance would be $2,700, followed by the record high of $2,790.
Read more
* The content presented above, whether from a third party or not, is considered as general advice only. This article should not be construed as containing investment advice, investment recommendations, an offer of or solicitation for any transactions in financial instruments.


