


Silver Price Forecast: XAG/USD rally stalls, sellers eye $60.00


Silver’s four-day rebound stalls as bearish structure remains intact.
RSI flattens below 50, signaling sellers are regaining control.
Break below $61.45 exposes $56.61 and $55.63 supports.
Silver price retreats by over 1% on Monday, even as the Greenback and US Treasury yields edge lower, with the white metal threatening to drop below $60 for the first time this week. At the time of writing, the XAG/USD trades at $61.80, after peaking at around $63.28 earlier during the day,
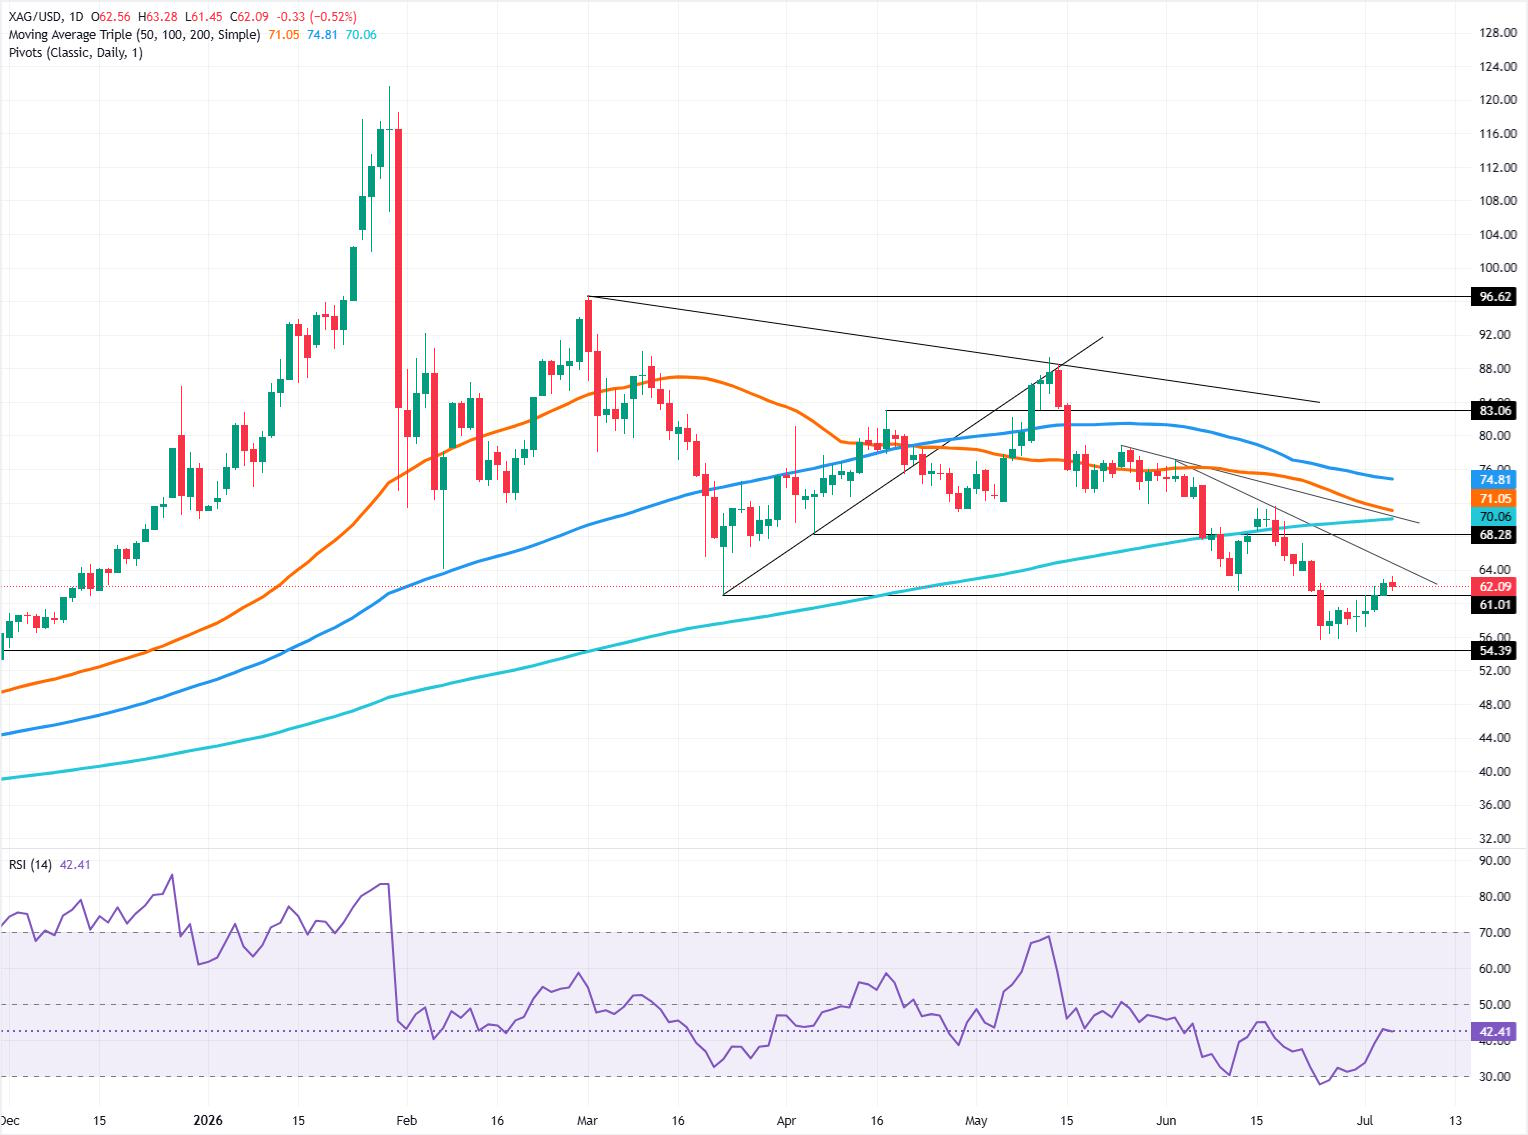
XAG/USD Price Forecast: Technical outlook
Overall, the XAG/USD is downwardly biased, as last week’s four-day rally stalled for several reasons. First, geopolitical risk premium is out of the picture, and second, a potential “death-cross” in the daily chart increases the likelihood of further losses.
Momentum is flatline after four days of bulls gathering traction. However, the Relative Strength Index (RSI) turned flat after aiming towards its 50-neutral level, pointing downwards, hinting that sellers are moving in.
If XAG/USD dives below the low of the day of $61.45, this clears the path to challenge last week’s low of $56.61, June’s 30 daily low. Beneath that price level lies the June 24 cycle low of $55.63, ahead of the November 13, 2025, daily high turned support at $54.39.
On the upside, if Silver clears the June 22 high of the day (HOD) at $67.17, this opens the path to challenge the 200-day Simple Moving Average (SMA) at $70.06. Upwards lies the 50-day SMA at $71.05.
XAG/USD Price Chart - Daily
Read more
* The content presented above, whether from a third party or not, is considered as general advice only. This article should not be construed as containing investment advice, investment recommendations, an offer of or solicitation for any transactions in financial instruments.


