

Silver Price Forecast: XAG/USD keeps the bullish vibe above $33.50 as trade war escalates

- Gold Price Forecast: Oil Price Breaking $100 Fuels Inflation Concerns, Will Gold Prices Fall Further?
- Gold Price Trend Forecast: Expectations of Easing US-Iran Tensions Boost Gold Prices, $4,070 Becomes Key Level for Bulls and Bears
- Gold rallies to over two-week high, eyes $4,150 as traders track US-Iran diplomacy efforts
- Euro declines to near 1.1400 as US launches fresh strikes on Iran
- Tesla Q2 Earnings Preview: Record Deliveries Fail to Hide Profit Pressure, Can Musk Rely on AI and Autonomous Driving to Unlock New Growth Space?
- WTI climbs above $87.00 as Middle East conflict threatens key choke points

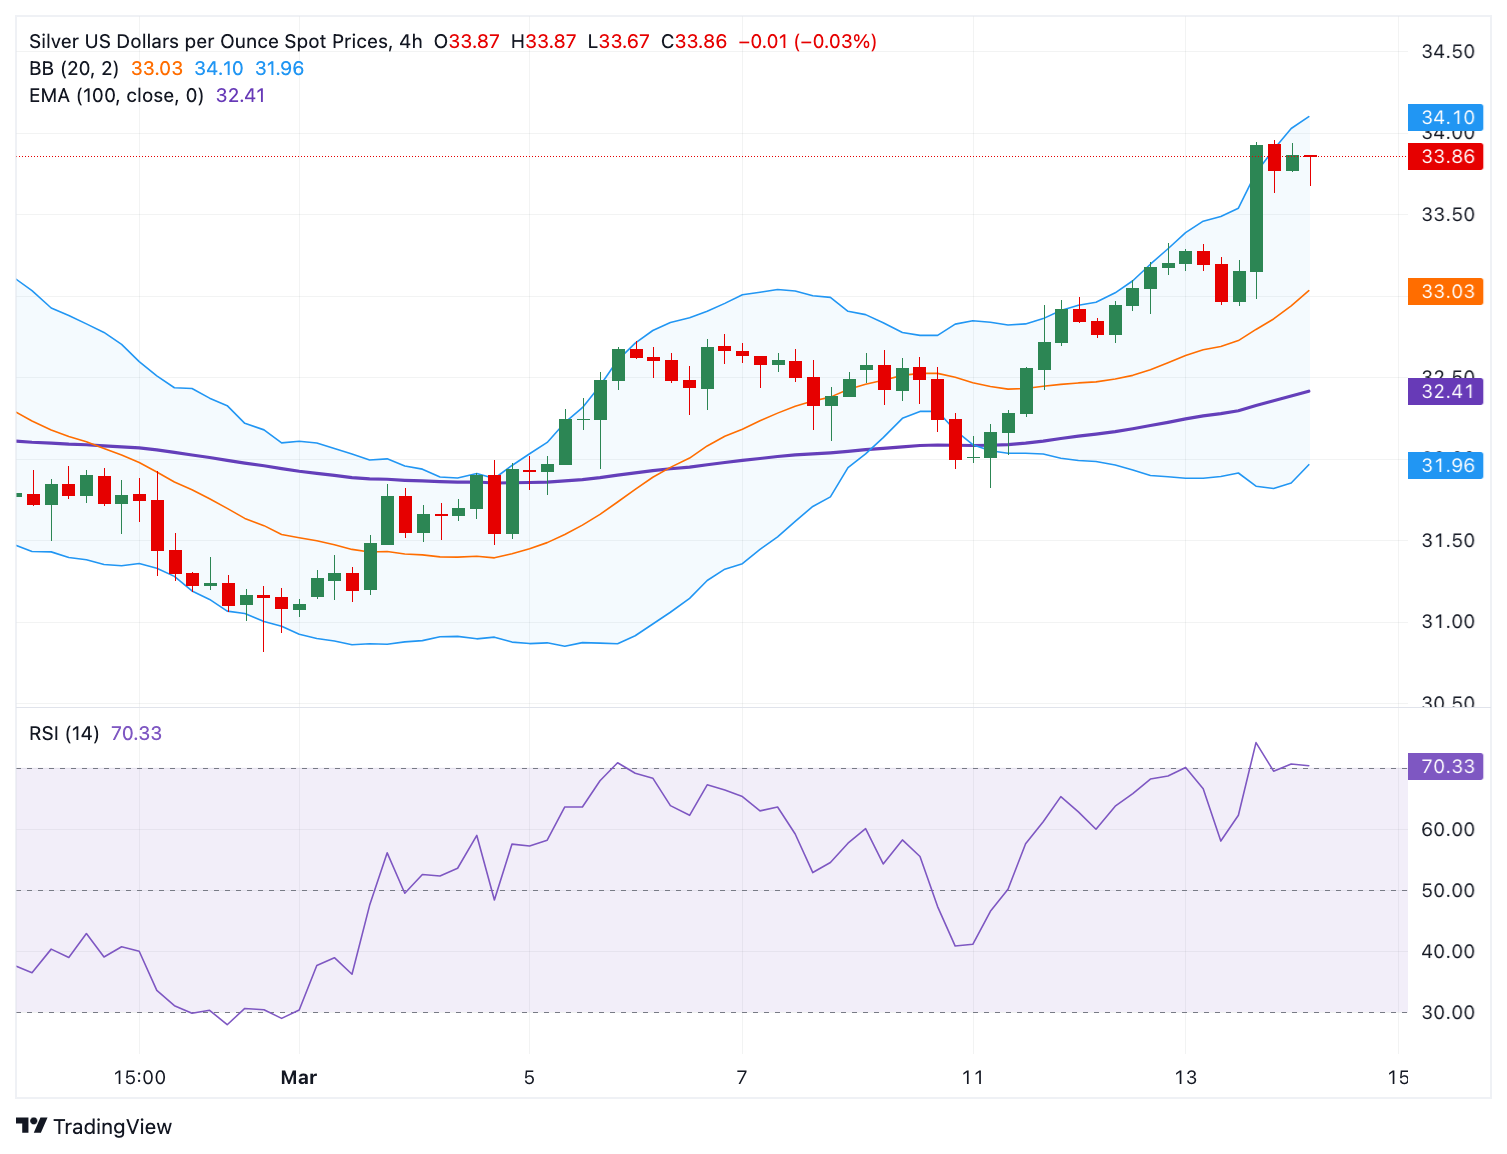
Silver price drifts lower to $33.75 in Friday’s early Asian session.
The positive bias of the metal prevails above the 100-period EMA, with the bullish RSI indicator.
The key resistance level emerges at the $34.00-$34.10 region; the first downside target to watch is $32.94.
The Silver price (XAG/USD) loses momentum to near $33.80 during the early Asian session on Friday. However, the downside for white metal might be limited as the softer US consumer and producer inflationary pressures could pave the way for the Federal Reserve (Fed) to cut interest rates in the June policy meeting, which provides some support to the white metal.
Furthermore, the fear that protectionism from US President Donald Trump will push the United States, the world’s largest economy, into recession might contribute to Silver’s upside.
According to the 4-hour chart, the constructive outlook of the Silver price remains in play as the white metal holds above the key 100-period Exponential Moving Averages (EMA). Additionally, the Relative Strength Index (RSI) stands above the midline near 67.00, indicating bullish momentum. This suggests that further upside looks favorable for XAG/USD.
The crucial resistance level for Silver emerges in the $34.00-$34.10 zone, representing the psychological level and the upper boundary of the Bollinger Band. A decisive break above this level could see a rally to $34.55, the weekly high of October 28, en route to $34.87, the weekly high of October 21.
On the flip side, the initial support level is located at $32.94, the low of March 13. A breach of this level could expose $32.41, the 100-period EMA. Any follow-through selling below the mentioned level could see a drop to near $32.00, the lower limit of the Bollinger Band and round figure.
Silver price (XAG/USD) 4-hour chart
Read more
* The content presented above, whether from a third party or not, is considered as general advice only. This article should not be construed as containing investment advice, investment recommendations, an offer of or solicitation for any transactions in financial instruments.


