

NZD/USD Price Forecast: Tests 0.5800 as bullish momentum fades

Source Fxstreet
  • NZD/USD tests 0.5800 as 50-day SMA caps recovery.
  • RSI turns bullish but fading slope warns of downside risk.
  • Break below 0.5762 exposes 0.5743 and 0.5700 supports.

The New Zealand Dollar gains over 0.30% against the US Dollar, poised to test key resistance levels, with the 50-day Simple Moving Average (SMA) at 0.5793, slightly below the 0.5800 figure. At the time of writing, the NZD/USD trades at 0.5789, after bouncing off daily lows of 0.5767.

NZD/USD Price Forecast: Technical outlook

The Kiwi Dollar seems to recover during the day, but the overall trend is downwards, until the pair reclaims the May 29 high of 0.5995. Momentum turned bullish as depicted in the Relative Strength Index (RSI), but seems to be fading as the index is about to pierce bearish territory.

As of writing, the NZD/USD is testing key resistance below 0.5800. A breach of the latter will expose the confluence of the 100- and 200-day Simple Moving Averages (SMAs) at 0.5823/24, followed by the July 21 high at 0.5874. Above this area, the next resistance is the 0.5900, followed by the May 29 high, beneath 0.6000.

On the other hand, if NZD/USD breaches the low of the week (LOW) of 0.5762, it opens the door for further downside. The next key support is the July 13 low of 0.5743, followed by 0.5700. Beneath lies the July 7 high at 0.5672.

NZD/USD Price Chart – Daily
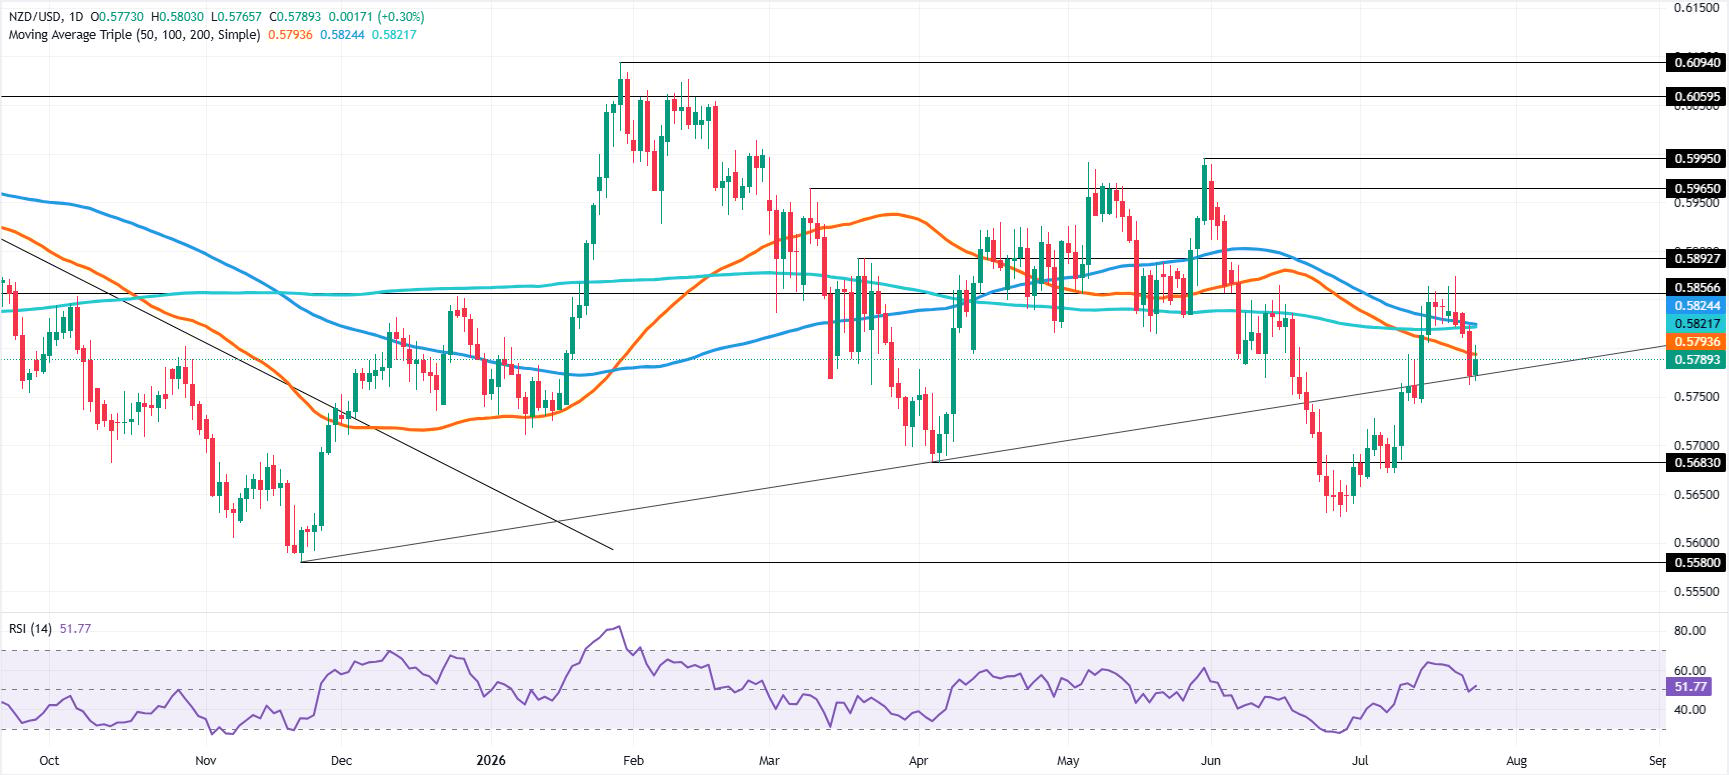
NZD/USD daily chart

New Zealand Dollar Price This week

The table below shows the percentage change of New Zealand Dollar (NZD) against listed major currencies this week. New Zealand Dollar was the strongest against the Swiss Franc.

USD EUR GBP JPY CAD AUD NZD CHF
USD 0.51% 0.95% 0.92% 0.58% -0.22% 0.77% 1.20%
EUR -0.51% 0.45% 0.35% 0.07% -0.73% 0.26% 0.69%
GBP -0.95% -0.45% -0.09% -0.38% -1.17% -0.19% 0.28%
JPY -0.92% -0.35% 0.09% -0.25% -1.09% -0.20% 0.38%
CAD -0.58% -0.07% 0.38% 0.25% -0.76% 0.05% 0.67%
AUD 0.22% 0.73% 1.17% 1.09% 0.76% 0.99% 1.46%
NZD -0.77% -0.26% 0.19% 0.20% -0.05% -0.99% 0.47%
CHF -1.20% -0.69% -0.28% -0.38% -0.67% -1.46% -0.47%

The heat map shows percentage changes of major currencies against each other. The base currency is picked from the left column, while the quote currency is picked from the top row. For example, if you pick the New Zealand Dollar from the left column and move along the horizontal line to the US Dollar, the percentage change displayed in the box will represent NZD (base)/USD (quote).

Disclaimer: For information purposes only. Past performance is not indicative of future results.
placeholder
Gold Price Forecast: Oil Price Breaking $100 Fuels Inflation Concerns, Will Gold Prices Fall Further?As of the Asian session on July 24, gold prices ( XAUUSD) fell continuously during intraday trading, briefly approaching the $4,000 mark. Looking at the chart, gold prices rebounded this
Author  TradingKey
11 hours ago
As of the Asian session on July 24, gold prices ( XAUUSD) fell continuously during intraday trading, briefly approaching the $4,000 mark. Looking at the chart, gold prices rebounded this
placeholder
Crude Oil Price Forecast: Middle East Tensions Push Up Oil Prices, Can They Still Rise After Breaking $100? Affected by the continuous escalation of geopolitical tensions in the Middle East, Brent crude ( UKOIL) broke back above the psychological $100-per-barrel threshold after two months, as m
Author  TradingKey
11 hours ago
Affected by the continuous escalation of geopolitical tensions in the Middle East, Brent crude ( UKOIL) broke back above the psychological $100-per-barrel threshold after two months, as m
placeholder
Today’s Market Recap: Oil Breaks $100, Fueling Inflation Fears, as AI Capex Faces Scrutiny and Tesla’s 14% Plunge Drags Down Tech SectorTracking the Market TrendTradingKey - The market was hit by a double whammy of soaring oil prices and doubts about the return on AI investments sparked by increased capital expenditures at Google(GOOG
Author  TradingKey
19 hours ago
Tracking the Market TrendTradingKey - The market was hit by a double whammy of soaring oil prices and doubts about the return on AI investments sparked by increased capital expenditures at Google(GOOG
placeholder
WTI Crude Breaks $90, Brent Crude Approaches $100, Middle East Shipping Risks Drive Continuous Rise in Oil Prices On July 23, international oil prices continued to rise sharply. WTI crude oil ( USOIL) prices broke through the $90 mark intraday, rising over 4%, while Brent crude oil ( UKOIL) rose to a
Author  TradingKey
Yesterday 10: 09
On July 23, international oil prices continued to rise sharply. WTI crude oil ( USOIL) prices broke through the $90 mark intraday, rising over 4%, while Brent crude oil ( UKOIL) rose to a
placeholder
WTI climbs above $87.00 as Middle East conflict threatens key choke pointsWest Texas Intermediate (WTI) oil price extends gains for the fifth consecutive day, trading around $87.30 per barrel during the Asian hours on Thursday. Crude oil prices surged as escalating Middle East tensions stoked fears of widespread supply disruptions.
Author  FXStreet
Yesterday 01: 15
West Texas Intermediate (WTI) oil price extends gains for the fifth consecutive day, trading around $87.30 per barrel during the Asian hours on Thursday. Crude oil prices surged as escalating Middle East tensions stoked fears of widespread supply disruptions.
Related Instrument
goTop
quote