


The Stock Market Is Flashing a Warning Sign Seen Only Once Before. History Is Clear About What Comes Next.
Key Points
It's been a record-breaking year for the market, but many investors are nervous about the future.
S&P 500 valuations are nearing historic territory, which could be a red flag for investors.
History still has plenty of promising news about what's coming.
- Motley Fool Issues Rare "Total Conviction" Buy Alert ›
This year has been one for the record books, and the market has had no shortage of surprises for investors. The S&P 500 (SNPINDEX:^GSPC), Nasdaq Composite (NASDAQINDEX:^IXIC), and Dow Jones Industrial Average (DJINDICES:^DJI) are up by roughly 14%, 10%, and 13%, respectively, over the last 12 months, despite recent volatility.
Many investors are not feeling optimistic, however. More than 51% of investors believe stock prices will sink in the next six months, according to a survey from the American Association of Individual Investors published on Nov. 11. Meanwhile, only 31% believe prices will climb.
Missed AI’s "Act 1"? Act 2 Could Be 15x Bigger. Most investors think they missed the AI boat because they didn't buy Nvidia in 2005. But according to our analysts, we’re only at the end of "Act 1"—the R&D phase. "Act 2" is the global rollout. Continue »
It's impossible to say where the market is headed in the short term, but one indicator is repeating a pattern seen only during the dot-com bubble. Here's where history says we could be headed.

Image source: Getty Images.
Stock valuations are nearing historic levels
The S&P 500 Shiller CAPE Ratio is a metric that measures the S&P 500's 10-year inflation-adjusted earnings. While it can't predict crashes or recessions, it can provide a snapshot of how valuations compare with those in previous market cycles.
The higher this metric climbs, the more likely the broader market is overvalued. Historically, stock prices also tend to fall in the years after this ratio peaks.
Its long-term average is around 17, and while there's no specific threshold indicating we're in a bubble, it's extraordinarily rare for this ratio to surpass 40. The dot-com bubble is the only period in history when this happened, when it remained above 40 consistently from January 1999 to September 2000. The bubble officially burst in March 2000.
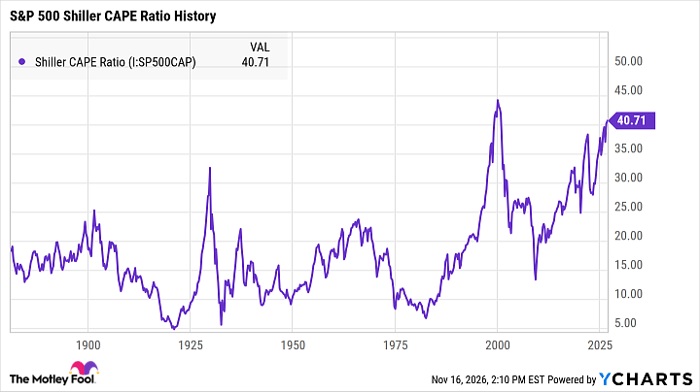
Shiller CAPE Ratio data by YCharts
Now, this metric is repeating a similar pattern. It's been hovering near 40 since summer 2025, eventually surpassing that threshold in May 2026.
This doesn't necessarily mean the market is going to crash. It does suggest, however, that the S&P 500 is the most richly valued it's been in decades, and investors would be wise to exercise caution in where they choose to buy right now.
What history says is coming next
With valuations soaring, investors would be wise to choose stocks carefully. Many stocks could be overvalued right now, as their soaring stock prices are being held up by shaky underlying business fundamentals. Weak companies can thrive in strong economic times, but they’re often hit hardest during market downturns.
The single best move investors can make right now is to invest in quality stocks and prepare to hold them for at least a few years. If history proves just one thing, it's that healthy companies are the most resilient over time.
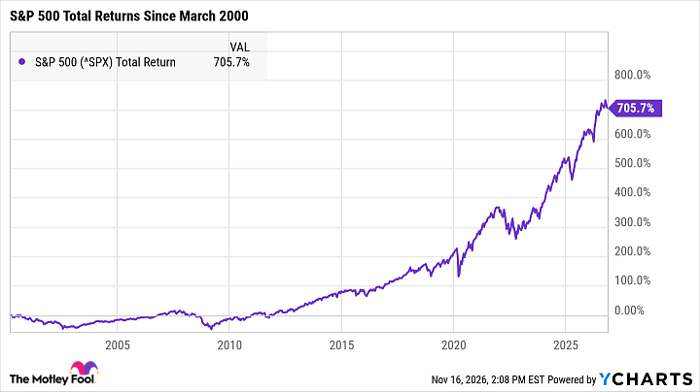
^SPX data by YCharts
There's still plenty of opportunity for investors right now, and undervalued stocks have the most growth potential. While no investment is immune to short-term volatility, companies built on strong foundations are the best positioned for lucrative long-term gains.
Since the dot-com bubble popped in March 2000, the S&P 500 has earned total returns of nearly 706% — turning a $10,000 investment into roughly $80,000 by today. No matter what the market does in the coming weeks or months, strong companies are the most likely to thrive over time.
Should you buy stock in S&P 500 Index right now?
Before you buy stock in S&P 500 Index, consider this:
The Motley Fool Stock Advisor analyst team just identified what they believe are the 10 best stocks for investors to buy now… and S&P 500 Index wasn’t one of them. The 10 stocks that made the cut could produce monster returns in the coming years.
Consider when Netflix made this list on December 17, 2004... if you invested $1,000 at the time of our recommendation, you’d have $327,620!* Or when Nvidia made this list on April 15, 2005... if you invested $1,000 at the time of our recommendation, you’d have $959,410!*
Now, it’s worth noting Stock Advisor’s total average return is 802% — a market-crushing outperformance compared to 205% for the S&P 500. Don't miss the latest top 10 list, available with Stock Advisor, and join an investing community built by individual investors for individual investors.
See the 10 stocks »
*Stock Advisor returns as of November 18, 2026.
Katie Brockman has no position in any of the stocks mentioned. The Motley Fool has no position in any of the stocks mentioned. The Motley Fool has a disclosure policy.
Recommended Articles


