


Intel Stock Forecast: Kiryat Gat Blast and Foundry Doubts Push INTC Toward $81.64 Before Q3 Earnings
TradingKey - INTEL CORP (NASDAQ: INTC) lost 5.8% on Friday to close at $89.85 after dropping 2.8% the previous day to close at $95.37. INTC is currently trading about 37% down from its 52-week high of $142.35 and below the $95 price of its August stock offering.
Although my thesis is slightly bruised, I don’t believe the numbers underlying my thesis have changed. I see the decline this week as an excellent opportunity to buy more shares.
The Kiryat Gat Explosion: Impact Still Unknown
On October 14, a fatal explosion at Intel’s Kiryat Gat site in Israel occurred while trucks were transferring gas to storage tanks. The Israel Fire Authority said the gas was nitrogen trifluoride, a gas used in the chipmaking process. Two employees died and a third was seriously injured. This Fab 28 facility produces chips for Intel processors.
Intel has not commented on any impact to production. The main thing I will be looking for on the 3Q earnings call is any comments regarding lost production or supplies for the 4Q. I believe any comments relating to these will be more newsworthy than the headlines themselves.
Terafab: A Foundry Narrative Under Pressure
Intel joined Musk's Terafab chip venture in April, and on October 4, Musk confirmed discussions with TSMC regarding joining Terafab, stating “something may come of it.” Intel said it would continue to participate.
This is important because a marquee partner talking to TSMC weakens the case that Intel is the preferred foundry partner. The Foundry business is the core of the bull case.
The Last Quarter Was Strong
The second quarter was the strongest quarterly revenue growth in over 15 years for Intel. Revenues for the quarter grew 25% year-over-year to $16.1 billion and non-GAAP EPS was $0.42 compared to a loss of $0.10 a year ago. Data Center and AI revenues grew 59% year-over-year to $6.3 billion and Data Center and AI operating income grew to $2.5 billion from $0.6 billion a year ago. Non-GAAP gross margin improved 12.1 points to 41.8%.
The $11.0 billion, or $2.16 per share, GAAP loss, however, requires context. Around $12.5 billion of this loss was non-cash, largely from mark-to-market losses on shares held in escrow under Intel’s CHIPS Act agreement, which does not impact cash.
Foundry Losses, Capex and Dilution
Intel Foundry revenue grew 31% to $5.8 billion. The segment lost $2.1 billion compared to $3.2 billion the prior year. Revenue from external foundries remains small.
What is more interesting, in my opinion, is the investment. Intel expects capex for 2026 to exceed $20 billion and said 2027 will be significantly higher. In August, Intel sold $20 billion of stock at $95 per share (upsized from $15 billion), and with shares now trading below that price, dilution is a visible cost of the turnaround.
What the Street Expects for Q3
Intel guided Q3 revenue to $15.8 billion to $16.8 billion, with non-GAAP gross margin expected to be near 42% and non-GAAP EPS expected to be $0.38. I will focus on whether revenues come in at the top end of the range, and whether there is any Q4 guidance, plus any update on the status of the Kiryat Gat fab.
There is a mixed outlook. Melius Research has a $200 price target within two years, compared to a more subdued average of ~$118 and Hold ratings.
Intel Technical Analysis: INTC Slips Below Rising Trendline as Bears Target $81.64
On my 4-hour chart, INTC closed at $89.76, down 1.36% from its previous close. Overnight quotes place the stock as high as $92.71. INTC has been trending down since it peaked at $126.78, losing $116.95, $106.57 and $95.50 in the process. The decline has caused the price to break below the rising trendline that had supported the price since the July lows. INTC is currently trading below the moving averages that sit at $106.16 and $105.35, respectively, and the moving averages are crossing over in a bearish fashion.
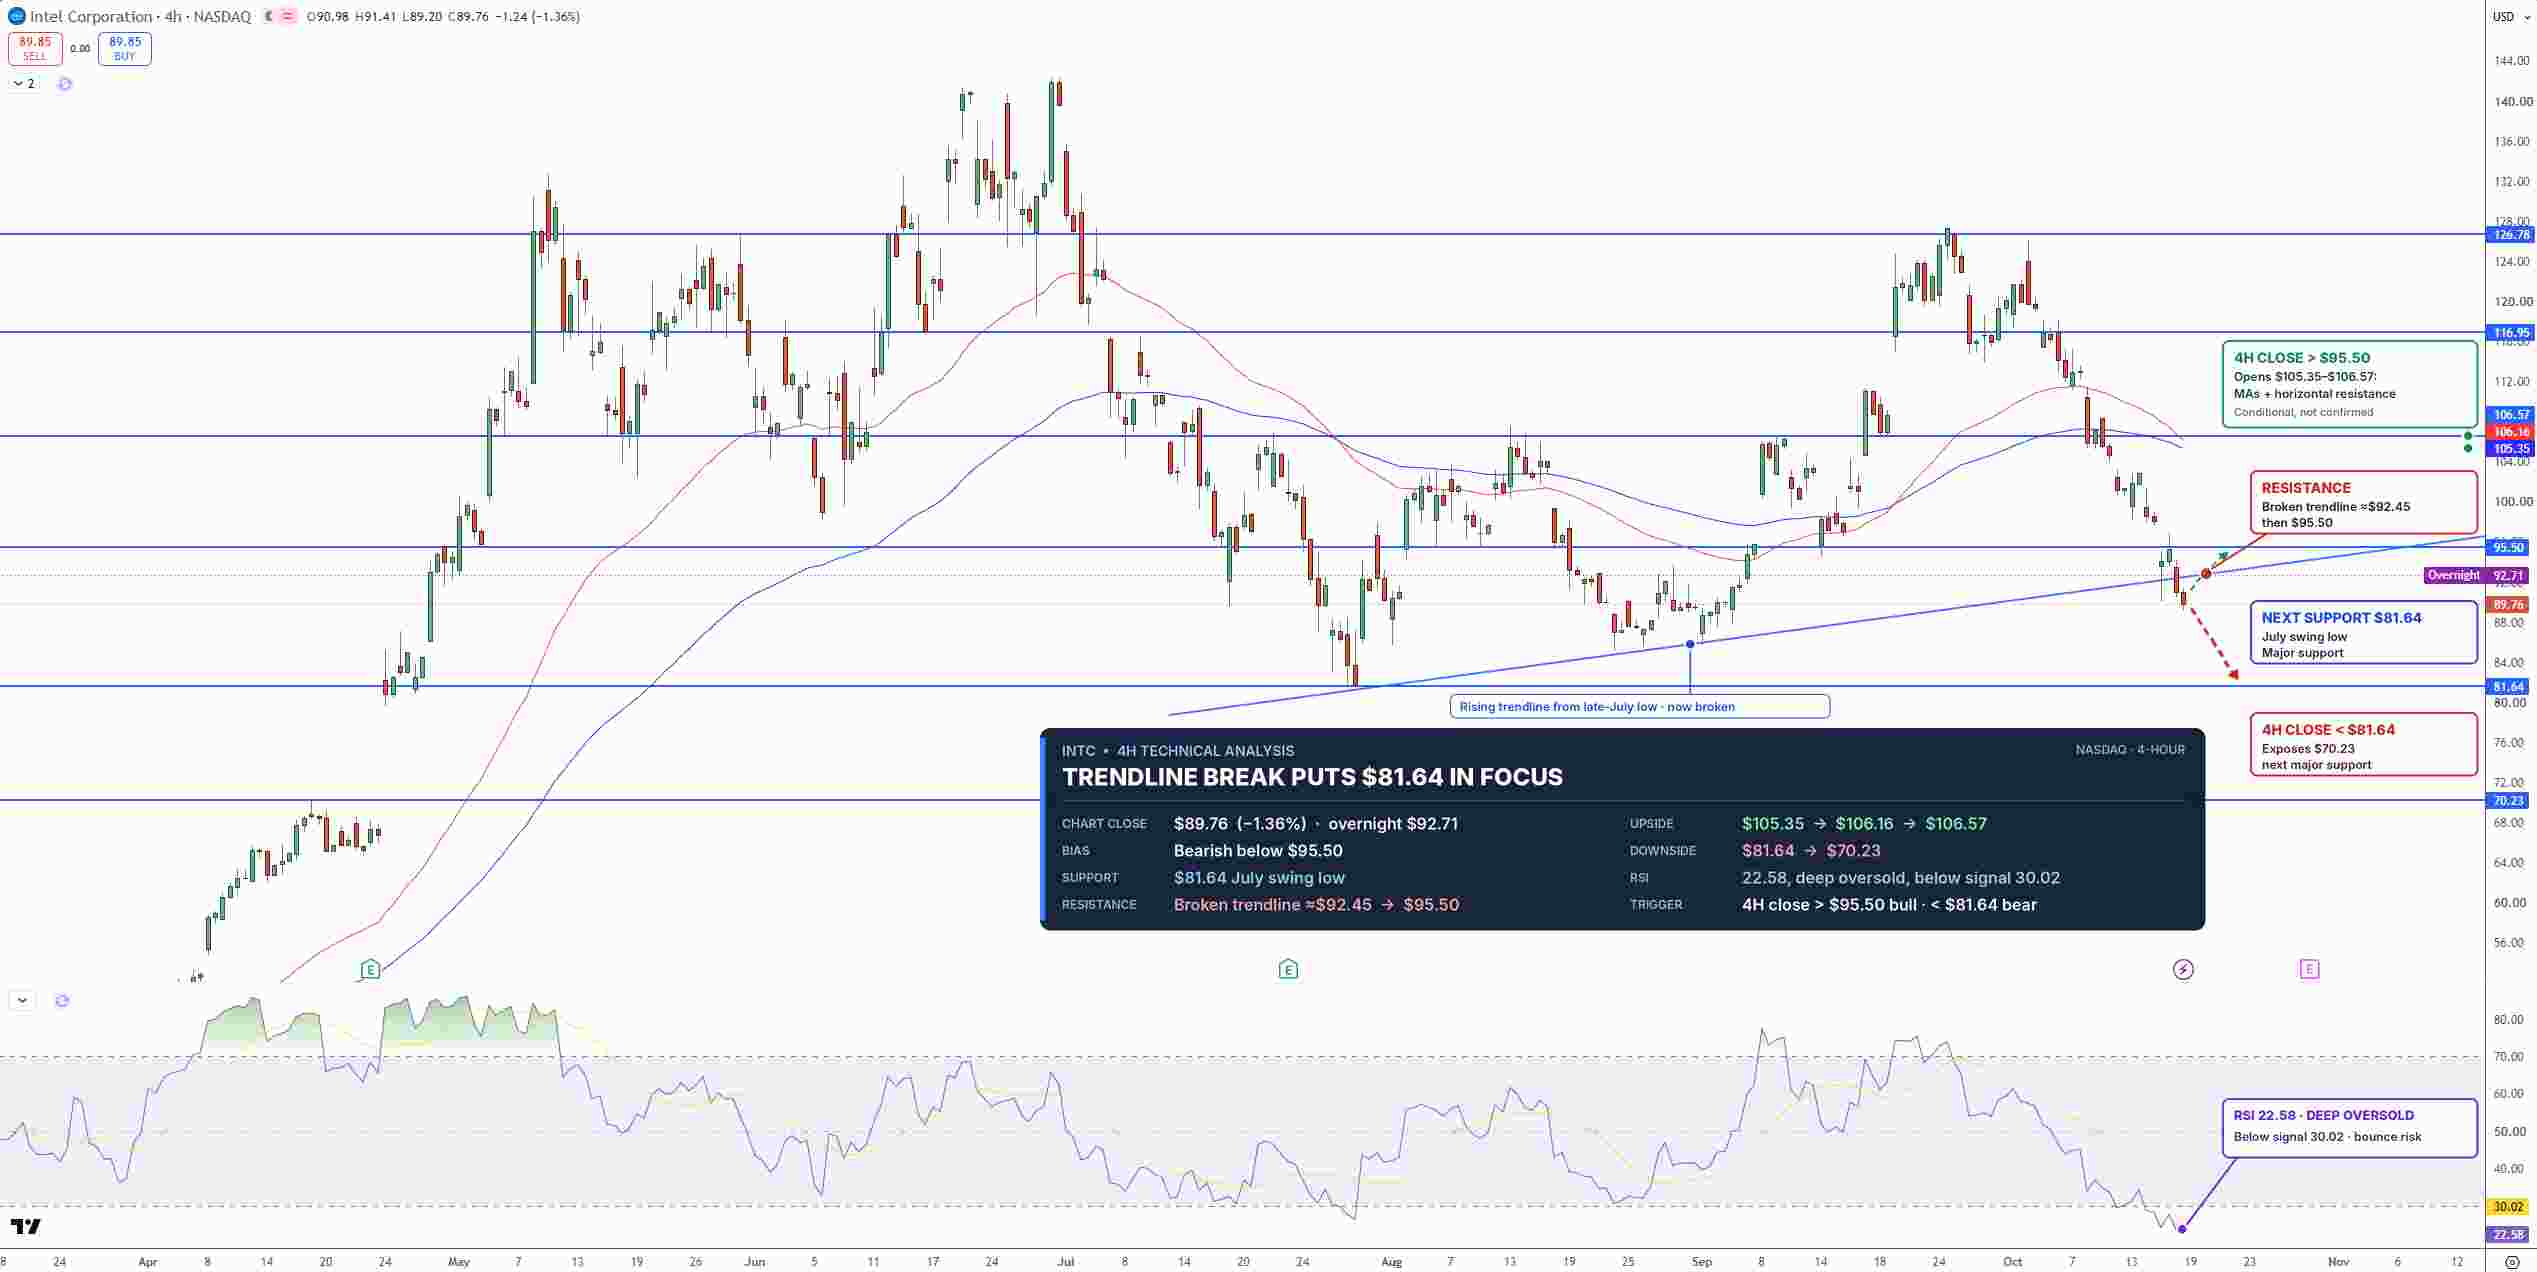
Intel Stock Price Chart - Source: Tradingview
The RSI is sitting at 22.58, which is below its signal line at 30.02, and is deep in oversold territory. While there is bearish momentum, readings this low increase the probability of a relief bounce. The 4-hour trendline provides immediate resistance at $92, and $95.50 offers resistance thereafter. A 4-hour close above $95.50 would bring $105.35 and $106.57 into play. A 4-hour close below $81.64 would open $70.23.
I am bearish as long as INTC is trading below $95.50. A retest of the $92 trendline is possible before a larger decline resumes.
Key Levels
Last Close: $89.85 (-5.8% on 10/16)
Support: $81.64, $70.23
Resistance: $92.00, $95.50, $105.35 to $106.57
RSI: 22, below its 30.02 signal line
Bullish Trigger: Close $95.50
Bearish Trigger: Close $81.64
FAQs
Why did Intel stock fall last week?
Intel fell on October 14 after an explosion at its Kiryat Gat site in Israel, broader chip sector weakness and uncertainty around Intel’s role after Musk confirmed talks with TSMC.
What is the Intel stock forecast before Q3 earnings?
The bias is bearish below $95.50. A close below $81.64 targets $70.23 and a close above $95.50 targets $105.35 to $106.57.
Bottom Line
Q2 proved the turnaround can drive growth but the stock requires confidence building on October 29. The risk reward is an oversold bounce to $95.50 if Kiryat Gat proves contained and the Q3 report lands at the high end of guidance. Maintaining losses and further dilution are risks. A close above $95.50 negates the bear case and a close below $81.64 confirms it.
Recommended Articles


