


Bitcoin vs Gold Forecast: BTC edges up, XAU struggles below $4,200 as Fed decision stays in focus
- Bitcoin gains momentum for the second straight day and trades toward $83,000 on Monday.
- Gold remains constrained below $4,200 despite a subtle MACD buy signal and support at $4,100.
- Traders are still jittery after last week’s US CPI report and remain focused on the Fed's October 28 rate decision.
Bitcoin (BTC) trades higher, above $82,000 on Monday, helping lift broader crypto market sentiment after last week's correction near $80,000. The release of the United States (US) Consumer Price Index (CPI) report, which showed sticky inflation, caught many by surprise and triggered the sell-off in the second half of the week.
Gold (XAU/USD) remains constrained between support at $4,100 and resistance at $4,200. Attempts to breach this upper range limit have continued to fail, causing buyer exhaustion, while dips remain undersubscribed, leading to lethargic price action.
October Fed decision on the horizon
The Federal Reserve (Fed) is widely expected to hold interest rates flat in the 3.75-4.00% range on October 28 amid the central bank’s race to control inflation, which remains notably above the long-term 2% target. The CME FedWatch Tool reinforces this outlook, with 83% odds, while only 13% of interest rate traders price in a 25-basis-point hike.
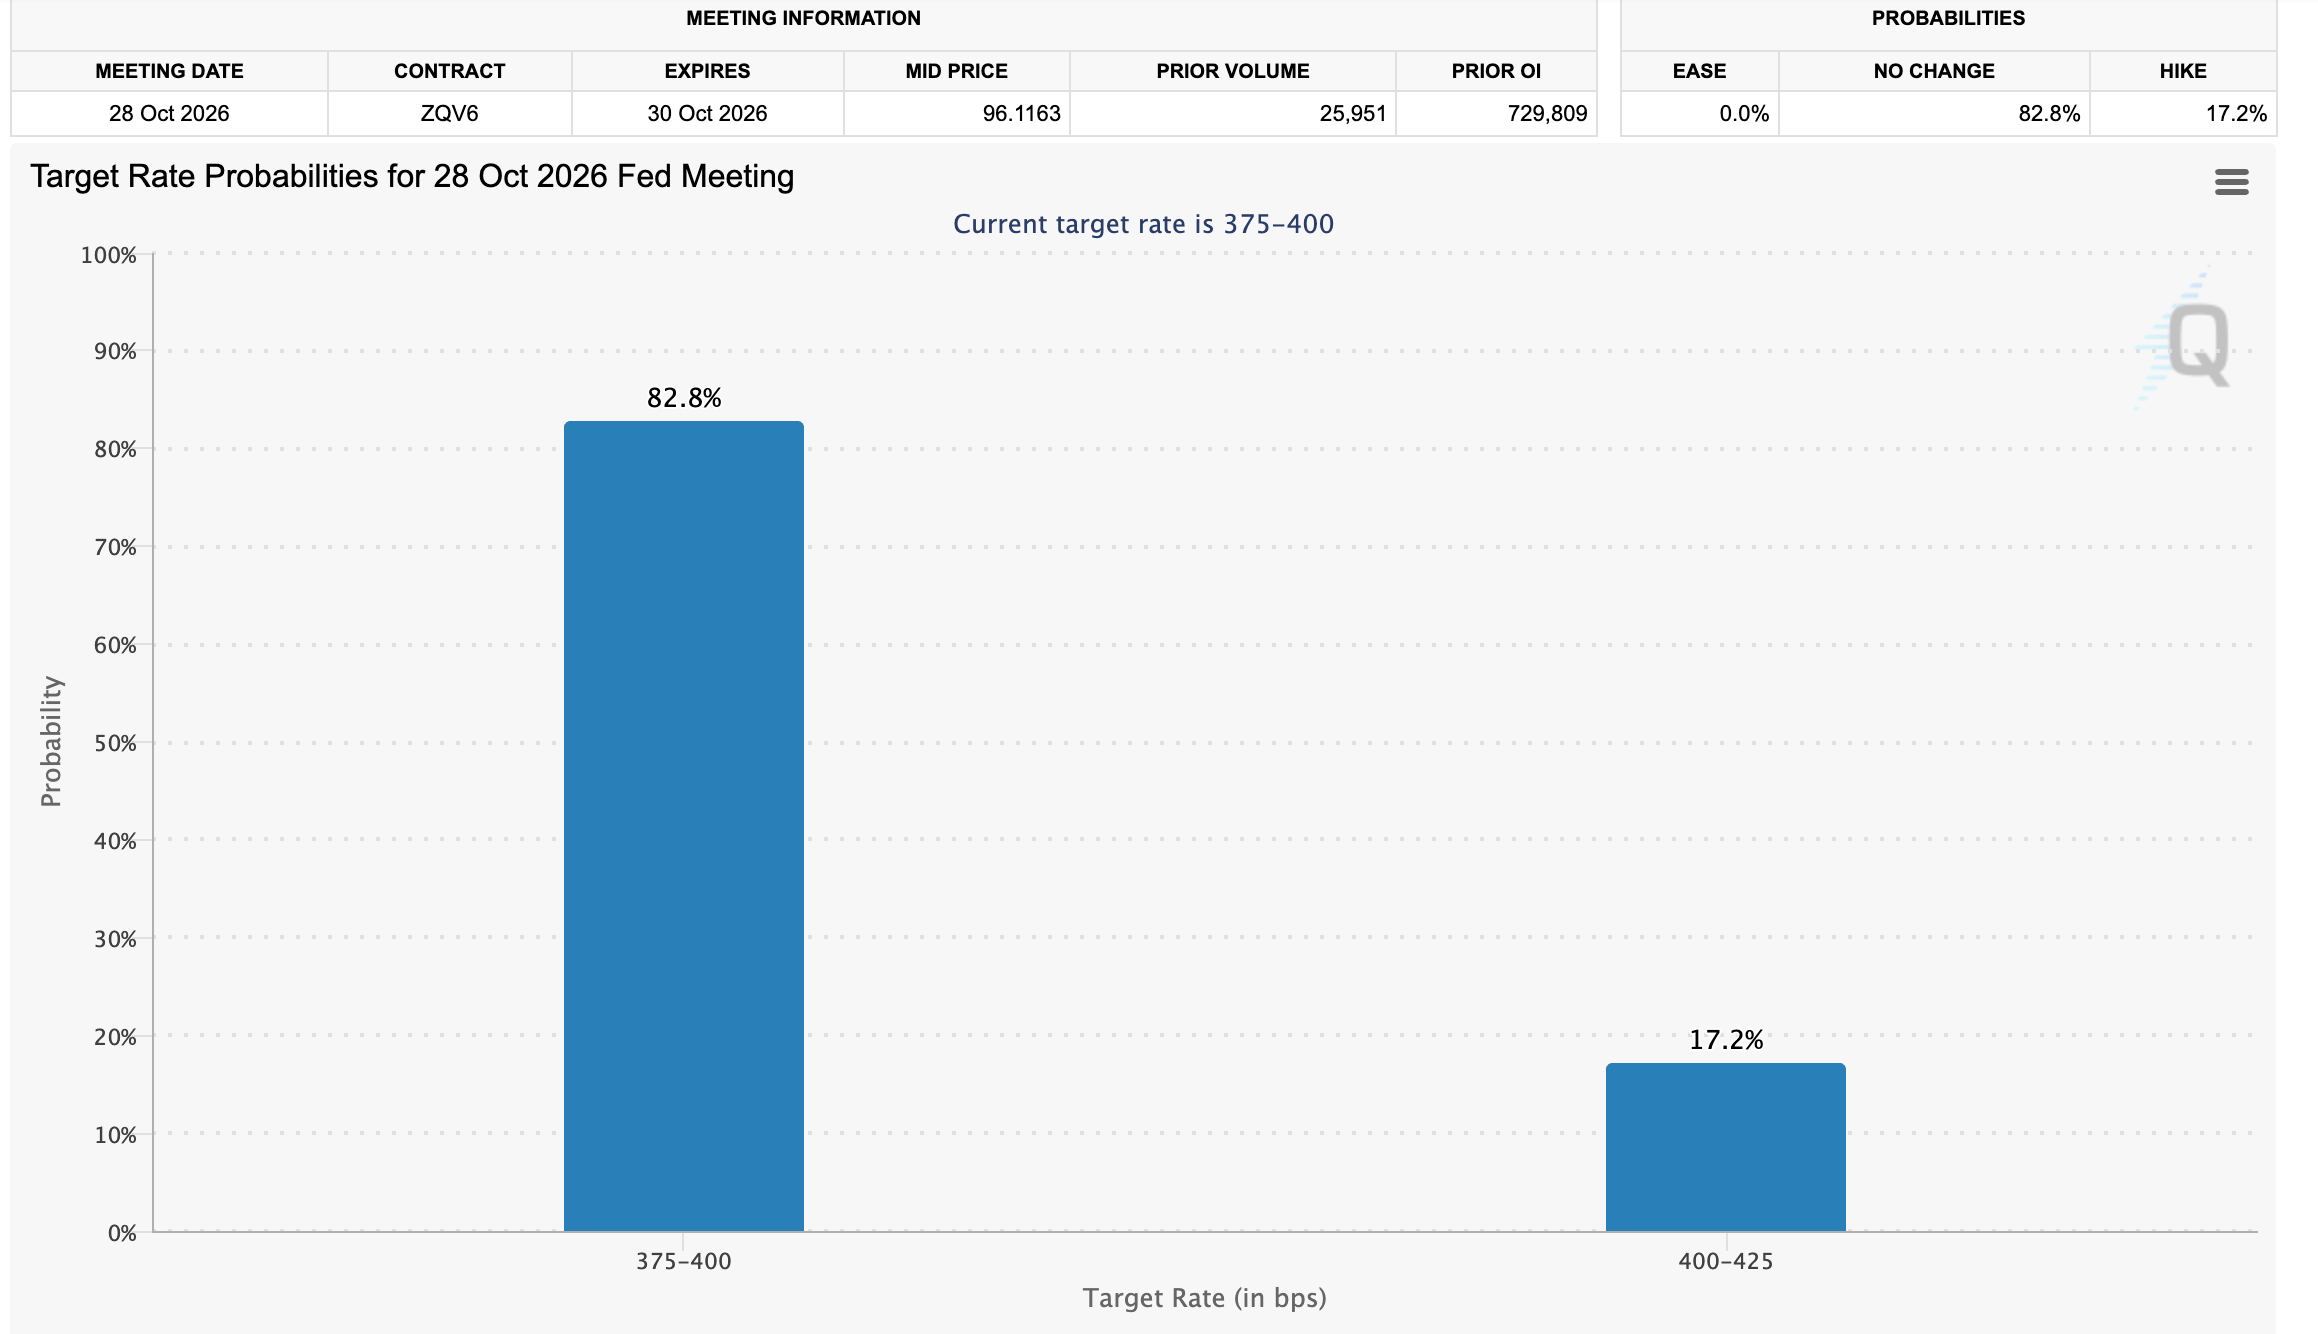
The Federal Reserve Open Market Committee (FOMC) unanimously voted to raise rates in September for the first time in three years, citing higher Oil and energy prices due to the extended geopolitical tensions in the Middle East. Bets remain higher for a December rate hike, with the coming weeks likely to come under scrutiny.
“Fed Chair Warsh’s Friday remarks brought October hike odds toward 15%, down from approximately sub-30% earlier in the week. This retreat in yield expectations and reduced near-term tightening probability provided support for risk assets including Bitcoin during the recovery phase,” QCP said in the Market Colour report.
Technical analysis: Bitcoin builds momentum above key support
Bitcoin trades at $82,725, holding a constructive bullish bias as price remains clearly above the 50-day, 100-day and 200-day Exponential Moving Averages (EMAs) clustered between roughly $76,000 and $80,600. This configuration suggests the broader uptrend stays intact despite a recent loss of upside momentum, while the SuperTrend indicator at 79,664 reinforces the idea of a supportive floor just beneath spot.
Momentum signals are mixed, with the Relative Strength Index (RSI) near a neutral 51 and the Moving Average Convergence Divergence (MACD) still in negative territory, hinting that bulls retain control but without strong impulsive follow-through for now.
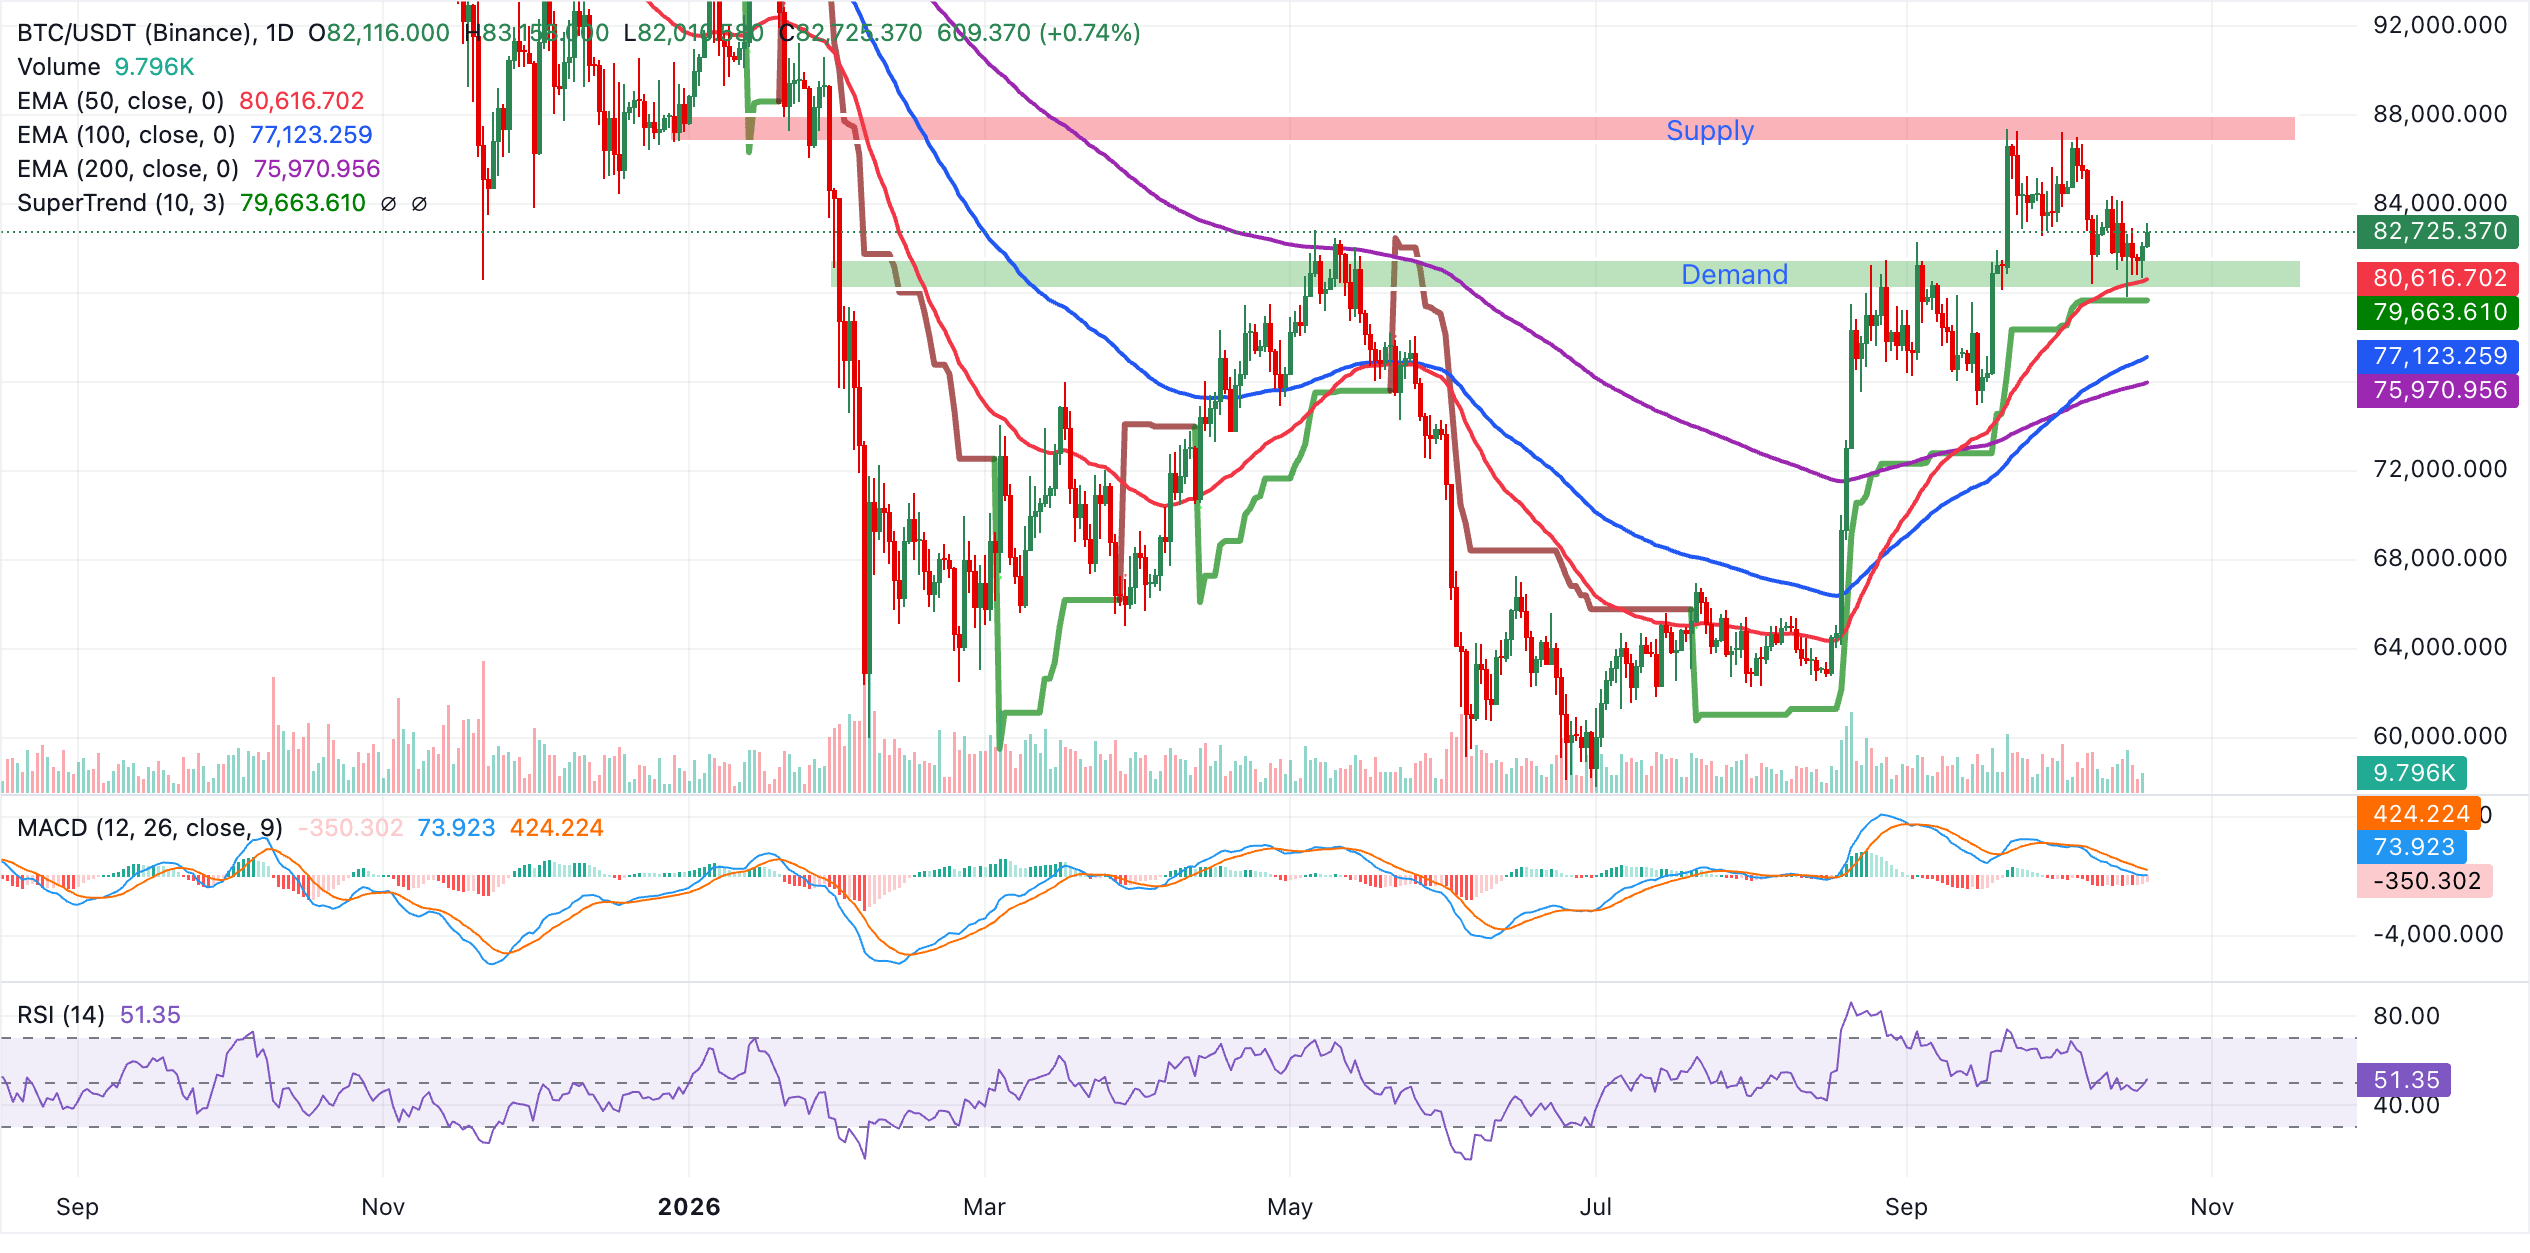
Immediate support lies at the 50-day EMA around $80,617, with the SuperTrend line at $79,664 forming a nearby secondary cushion if a deeper pullback unfolds. Below that, the 100-day EMA at $77,123 and the 200-day EMA at $75,970 are expected to act as more strategic demand zones where dip-buying interest could re-emerge as long as the broader trend structure remains unchanged.
"Bitcoin is still well below its high from a year ago, but the selling that defines bear markets is largely spent. An enormous amount of old supply has already changed hands during this cycle and now sits with holders who bought near current levels and rode out the 50% drawdown," Yusuf Fakhro, partner at ARP Digital, said in an emailed commentary, adding, "Those are not breakeven sellers. With few determined sellers left, it does not take much fresh demand to push price higher once the macro mood turns."
Gold technical analysis: XAU sellers broadly retain trend control
Gold trades at $4,165, holding below the 50-day, 100-day and 200-day EMAs, which keeps the broader tone bearish despite the recent stabilization. The cluster of EMAs between roughly $4,251 and $4,301 forms a dense overhead supply area, while the prior break reference of the descending resistance trendline around $4,039 now acts as underlying structural support.
Momentum is mixed, with the MACD indicator back above zero and advancing, hinting at recovering short-term demand, but the RSI near 45 still suggests only modest buying interest within a capped market.
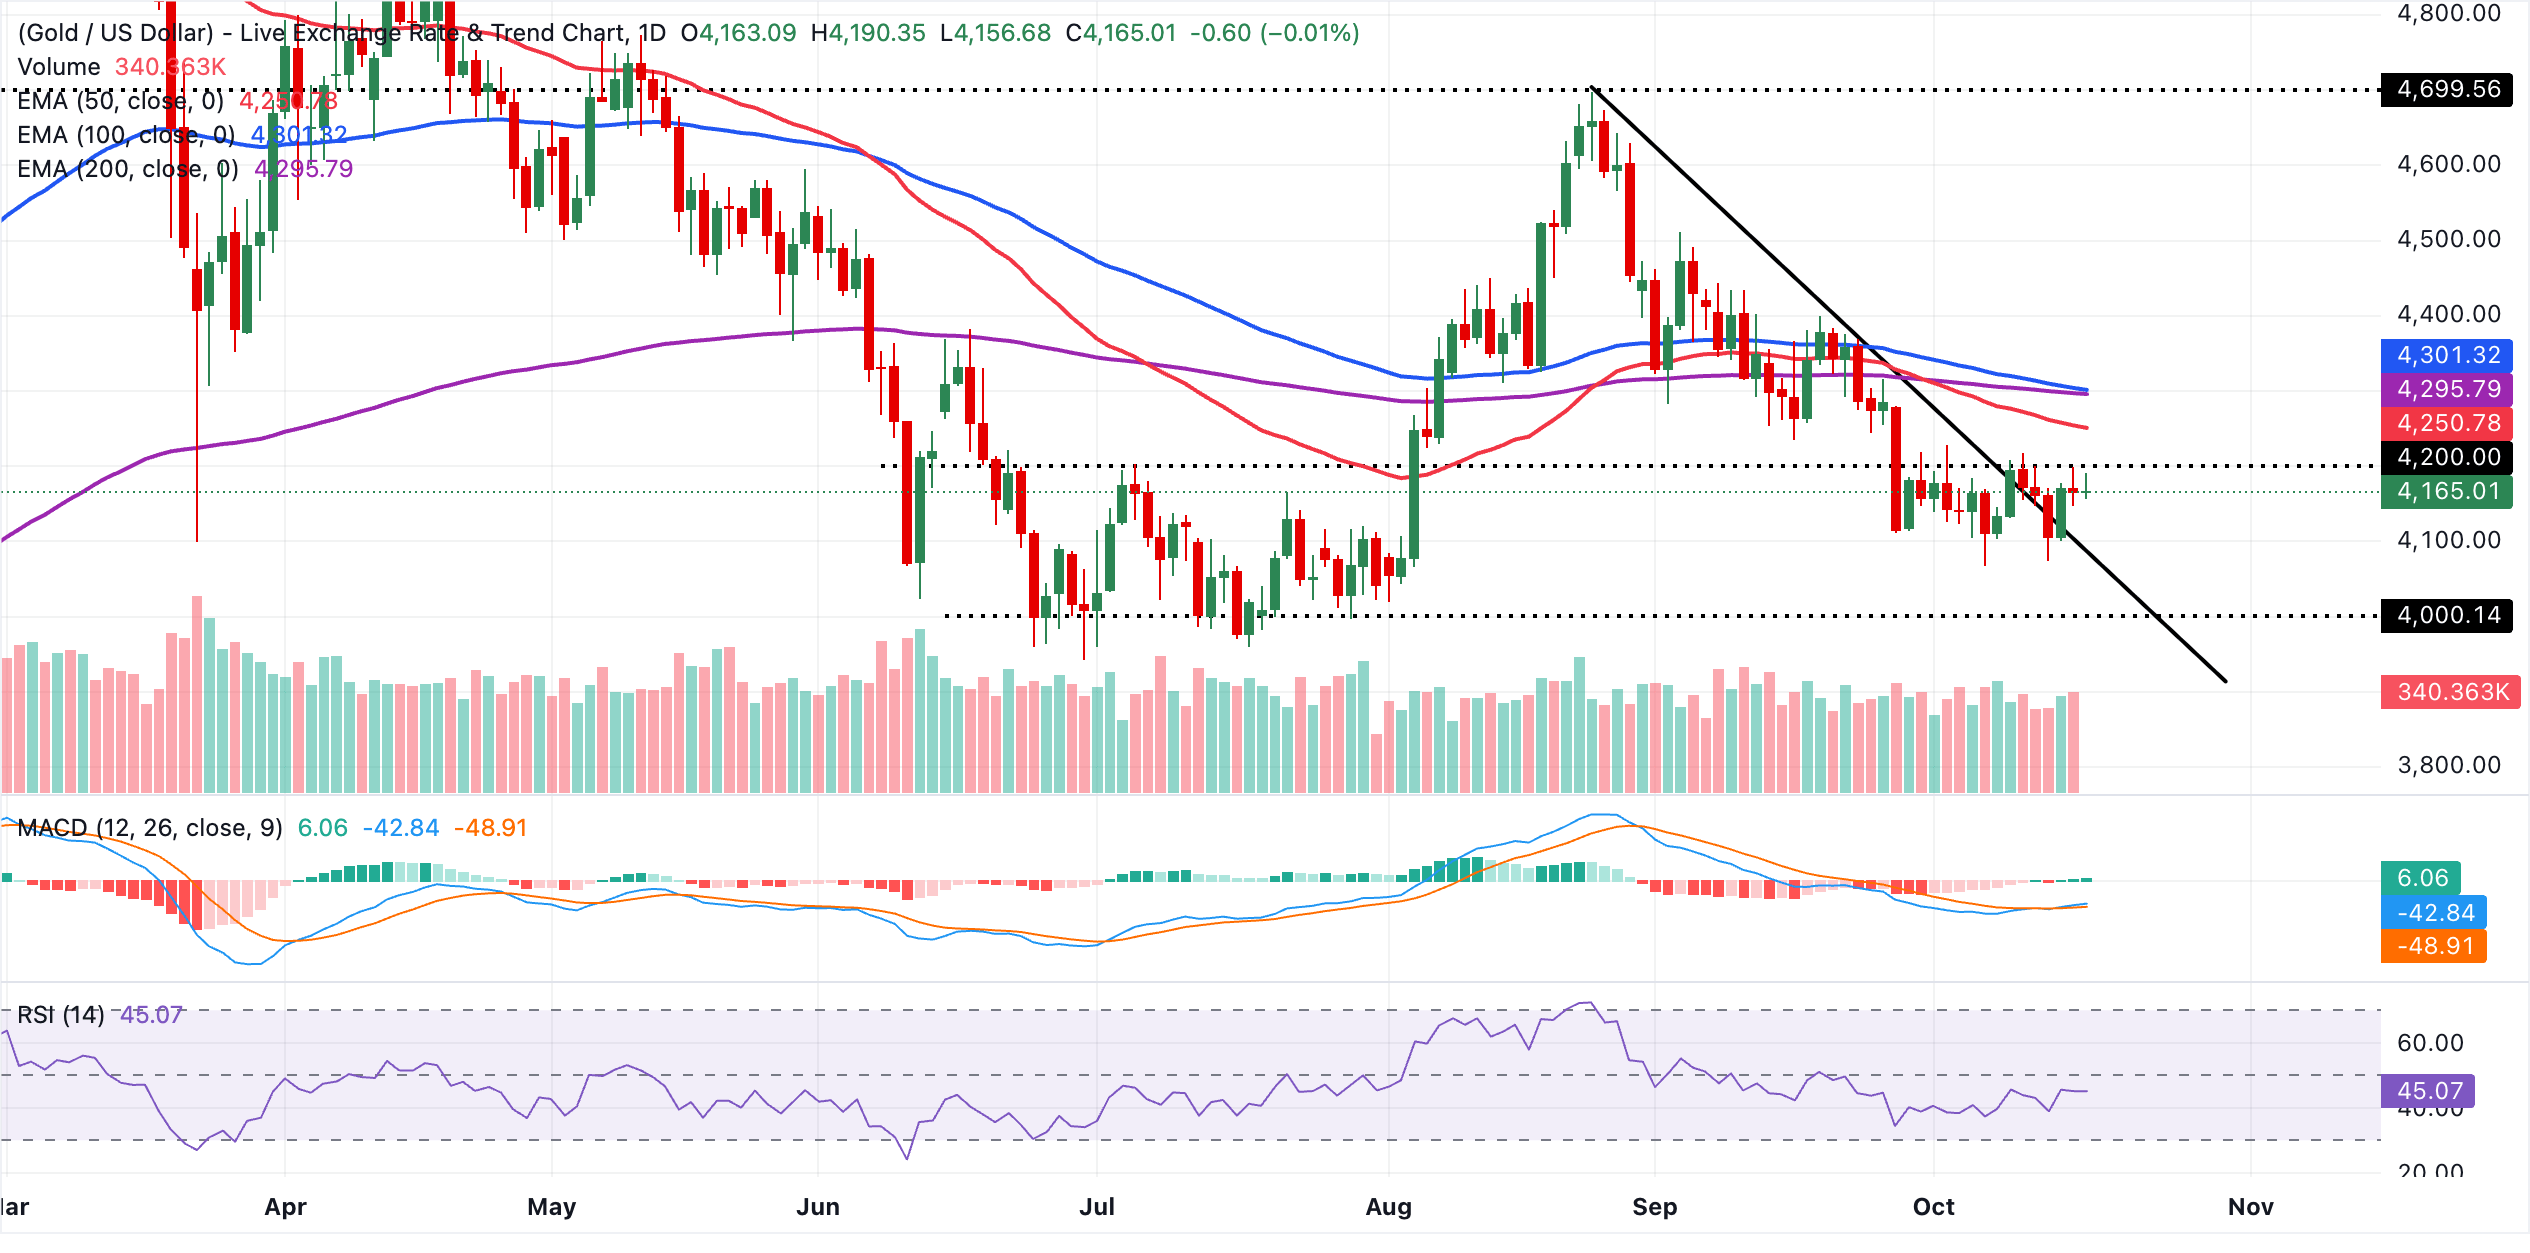
Initial resistance lies at the 50-day EMA near $4,251, followed by the 200-day EMA at $4,296 and then the 100-day EMA at $4,301, where sellers are likely to ramp up the battle to retain the prevailing downtrend.
The first notable support appears at the prior trendline-break area around $4,039. A sustained drop back towards that zone would reopen the path to deeper corrective losses, while holding above it would keep XAU/USD confined to a consolidation phase beneath the EMA ceiling.
(The technical analysis of this story was written with the help of an AI tool. Know more.)
Bitcoin, altcoins, stablecoins FAQs
Bitcoin is the largest cryptocurrency by market capitalization, a virtual currency designed to serve as money. This form of payment cannot be controlled by any one person, group, or entity, which eliminates the need for third-party participation during financial transactions.
Altcoins are any cryptocurrency apart from Bitcoin, but some also regard Ethereum as a non-altcoin because it is from these two cryptocurrencies that forking happens. If this is true, then Litecoin is the first altcoin, forked from the Bitcoin protocol and, therefore, an “improved” version of it.
Stablecoins are cryptocurrencies designed to have a stable price, with their value backed by a reserve of the asset it represents. To achieve this, the value of any one stablecoin is pegged to a commodity or financial instrument, such as the US Dollar (USD), with its supply regulated by an algorithm or demand. The main goal of stablecoins is to provide an on/off-ramp for investors willing to trade and invest in cryptocurrencies. Stablecoins also allow investors to store value since cryptocurrencies, in general, are subject to volatility.
Bitcoin dominance is the ratio of Bitcoin's market capitalization to the total market capitalization of all cryptocurrencies combined. It provides a clear picture of Bitcoin’s interest among investors. A high BTC dominance typically happens before and during a bull run, in which investors resort to investing in relatively stable and high market capitalization cryptocurrency like Bitcoin. A drop in BTC dominance usually means that investors are moving their capital and/or profits to altcoins in a quest for higher returns, which usually triggers an explosion of altcoin rallies.
Recommended Articles


