


SCHD Is Down 6% From Its Peak. Here's Why History Says It's Still a Buy.
Key Points
The Schwab U.S. Dividend Equity ETF has delivered a 13.1% annualized returns since October 2011.
In the most recent bear market in 2022, it outperformed the S&P 500 by about 15 percentage points.
- 10 stocks we like better than Schwab U.S. Dividend Equity ETF ›
One big reason for concern about the U.S. stock market right now is whether the S&P 500 index is relying too much on tech stocks and the artificial intelligence (AI) build-out. In case major AI companies have to scale back their investments in data centers, the AI trade might turn into a sell-off.
The Schwab U.S. Dividend Equity ETF (NYSEMKT: SCHD) offers a different way to put money to work that could diversify your investments away from a possible AI bubble. Because it's not too tech-heavy, this dividend index fund might be more resilient in the case of an AI-driven sell-off in the S&P 500.
Missed Nvidia in 2009? This Rare Signal Is Flashing Again. In 2009, a "Double Down" signal flashed for a little-known chipmaker called Nvidia. For the first time in years, that same "Total Conviction" signal is flashing for a company 1/100th the size of Nvidia. Continue »
SCHD hit an all-time high of $35.31 on Aug. 24, and since then, its shares are down about 6%.
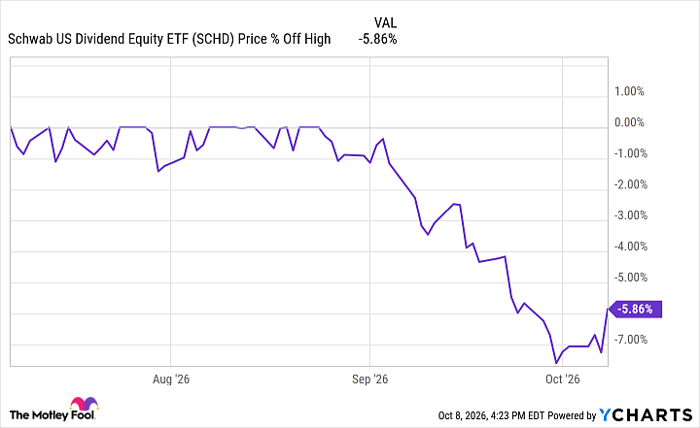
SCHD data by YCharts.
This dividend-focused ETF has an impressive track record of strong performance and a high dividend yield. As of this writing, SCHD is paying a 30-day SEC yield of 3.36%, which is more than 3x the dividend yield of the S&P 500 (only 1.04%).
Let's look at why SCHD could be a good buy for the next 10 years or more -- despite its recent share price decline.

Image source: Getty Images.
Schwab U.S. Dividend Equity ETF (SCHD): 15 years of 13.1% annualized returns
Buying high-yield dividend stocks is often a good strategy for investors who want to earn steady income. The Schwab U.S. Dividend Equity ETF also has a strong track record of delivering growth in share price.
For the past 15 years since the fund's inception in October 2011, it's delivered average annual returns (by net asset value, or NAV) of 13.11%. In the past year, SCHD has returned about 23.4% by NAV, outperforming the S&P 500.
If investors are worried that the S&P 500 has become too top-heavy with AI-related stocks, this Schwab fund could offer meaningful diversification away from the AI theme. The top sectors in SCHD are:
- Healthcare: 20.7% of the fund
- Consumer staples: 20.4%
- Energy: 14.1%
- Industrials: 11.6%
- Financials: 10.05%
It's possible that if the S&P 500 goes into a bear market, this fund will go through a big downturn as well. But if the AI trade turns out to be disappointing for tech investors, SCHD might be different enough to offer some protection. Dividend stocks and value-oriented companies might outperform the rest of the market.
How did SCHD do in 2022, the last time we had a bear market? As you can see from this chart, despite its negative total return, SCHD significantly outperformed the S&P 500.
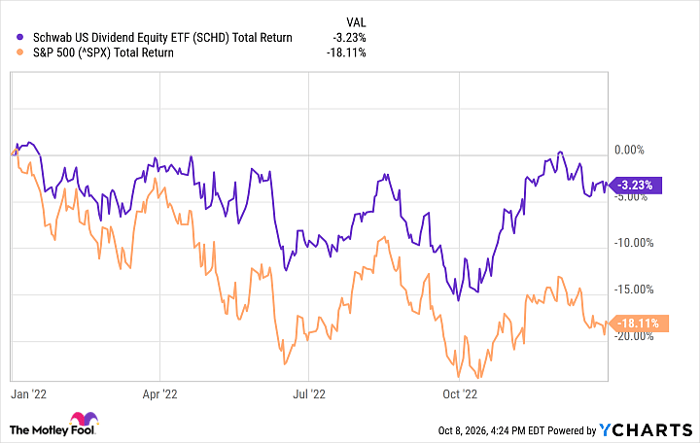
SCHD Total Return Level data by YCharts.
There's no such thing as a "safe stock" or recession-proof ETF. But if you're worried about a possible bear market looming for the S&P 500, or if you want income as well as growth from your stock holdings, the Schwab U.S. Dividend Equity ETF could be a good choice for the future.
Should you buy stock in Schwab U.S. Dividend Equity ETF right now?
Before you buy stock in Schwab U.S. Dividend Equity ETF, consider this:
The Motley Fool Stock Advisor analyst team just identified what they believe are the 10 best stocks for investors to buy now… and Schwab U.S. Dividend Equity ETF wasn’t one of them. The 10 stocks that made the cut could produce monster returns in the coming years.
Consider when Netflix made this list on December 17, 2004... if you invested $1,000 at the time of our recommendation, you’d have $379,123!* Or when Nvidia made this list on April 15, 2005... if you invested $1,000 at the time of our recommendation, you’d have $1,408,822!*
Now, it’s worth noting Stock Advisor’s total average return is 950% — a market-crushing outperformance compared to 215% for the S&P 500. Don't miss the latest top 10 list, available with Stock Advisor, and join an investing community built by individual investors for individual investors.
See the 10 stocks »
*Stock Advisor returns as of October 12, 2026.
Ben Gran has no position in any of the stocks mentioned. The Motley Fool has no position in any of the stocks mentioned. The Motley Fool has a disclosure policy.
Recommended Articles


