


ASTS Stock Price Forecast: SpaceX Plans to Acquire 800MHz Spectrum, Can ASTS Rebound After a 10% Drop?
TradingKey - On October 9 Eastern Time, AST SpaceMobile (ASTS) closed down 10.48% at $50.97, hitting an intraday low of $47.57 to set a new 52-week low, with volume reaching approximately 54.38 million shares.
On October 8, Grain Management announced a definitive agreement with SpaceX to sell its nationwide portfolio of 800 MHz spectrum licenses. The transaction remains subject to approval by the US Federal Communications Commission and the satisfaction of other closing conditions.
SpaceX (SPCX) expanding its presence in mobile communications raised market concerns over intensifying competition, serving as part of the backdrop for ASTS's decline that day.
SpaceX Seeks Low-Band Spectrum: What Competitive Risks Does ASTS Face?
The 800MHz low-band spectrum favors wide-area coverage and indoor signal penetration for terrestrial mobile networks. If the transaction closes and the required approvals are obtained, SpaceX can leverage these resources to advance the buildout of its Starlink Mobile integrated satellite-terrestrial network.
ASTS, meanwhile, plans to combine spectrum from partner operators with mobile satellite service spectrum acquired through agreements for usage rights or control to provide direct-to-cell services for standard smartphones. Competition between the two in the U.S. mobile communications market could expand further.
If SpaceX gradually builds an independent mobile network, ASTS could face pressure in acquiring customers, pricing services, and negotiating carrier partnerships. However, as the transaction has not yet closed and network deployment still requires regulatory approval and infrastructure construction, the actual impact remains to be seen.
ASTS stated on August 10 that it had established partnerships with over 60 mobile network operators globally, collectively covering more than 3 billion subscribers. While this scale represents a potential distribution channel, future revenues will still depend on service launches, user adoption, and contract execution.
TELUS Completes Network Integration Testing, Pushes 45-Satellite Target to Early 2027
On October 5, AST SpaceMobile and Canadian carrier TELUS announced the completion of their first network integration test, covering smartphone broadband data, voice calls, and text messaging connections. TELUS expects to offer related services to customers using compatible smartphones within the coming year.
In July, AST SpaceMobile adjusted its deployment target for approximately 45 BlueBird satellites to early 2027. The company disclosed in August that its network had 13 spacecraft in orbit at the time and planned to launch non-commercial beta services with select carriers in 2026. Subsequent deployments remain subject to satellite production, testing, and launch schedules.
In the second quarter, the company reported revenue of $31.5 million, primarily derived from gateway deliveries and U.S. government contract performance. In August, the company maintained its 2026 revenue guidance of $150 million to $200 million and disclosed a revenue backlog of approximately $1.3 billion tied to commercial partnerships and U.S. government contracts.
As of the end of June, the company's total cash, cash equivalents, and restricted cash stood at approximately $2.723 billion, including about $435 million in restricted cash. In July, the company raised total gross proceeds of $1.15 billion through a convertible bond offering. While the financing supplemented capital for construction, satellite production, launches, and ground facility buildouts will continue to require ongoing investment.
ASTS Technical Analysis: $47.57 Becomes Key Support
[Source: TradingView]
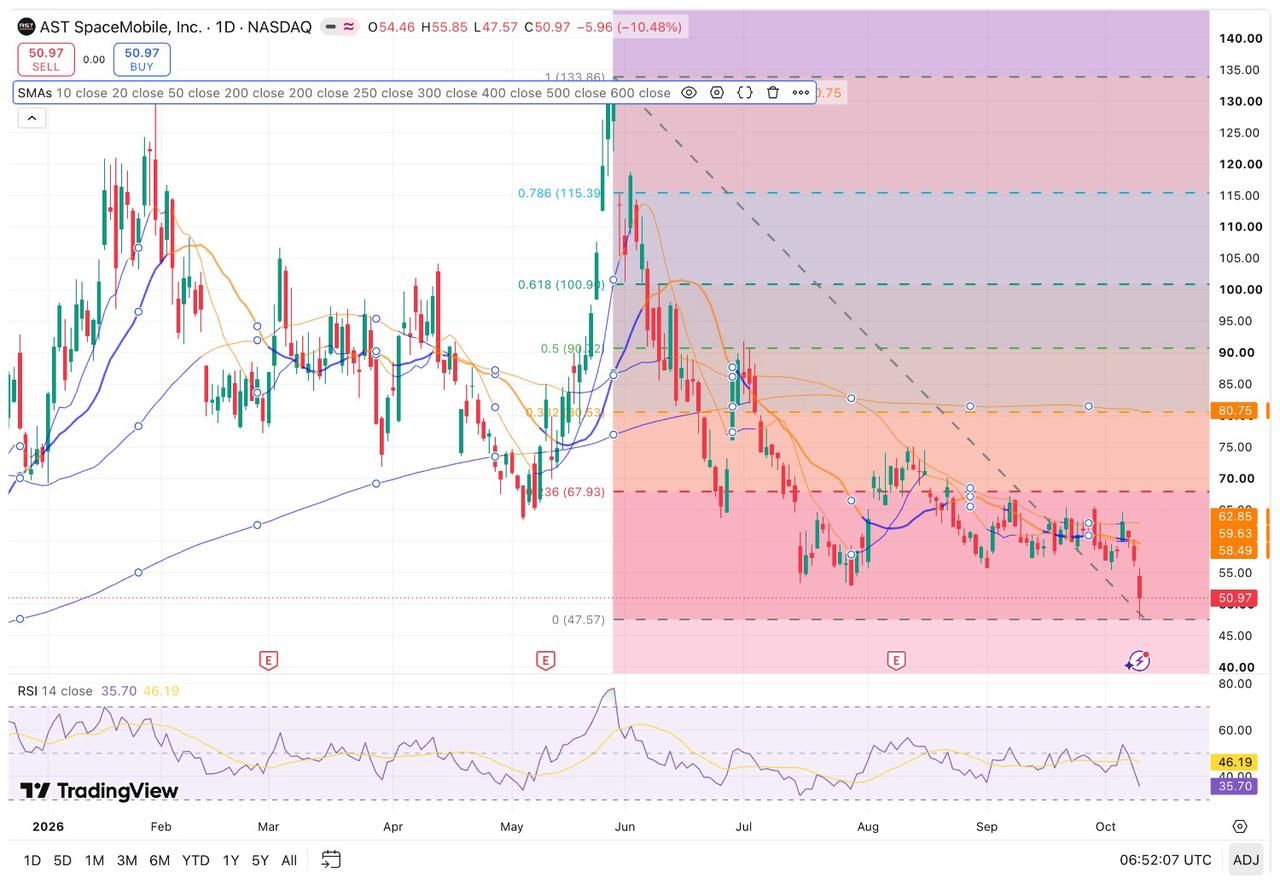
As of the close on October 9, ASTS stood at $50.97, below its 10-day, 20-day, 50-day, and 200-day simple moving averages, which are located at approximately $58.49, $59.63, $62.85, and $80.75, respectively. The 14-day RSI is around 36, indicating weak short-term momentum, though it has not yet entered the traditional oversold territory below 30.
Based on the range from the May 28 high of $133.86 to the October 9 low of $47.57, the 0.236 and 0.382 Fibonacci retracement rebound targets are $67.93 and $80.53, respectively. The $47.57 level has not yet been confirmed as the final bottom of this decline.
On the upside, the initial level to watch is the October 9 high of $55.85, followed by the moving average area between $58.5 and $59.6. If the stock further stabilizes around $62.85, attention may shift to $67–$68. These moving average levels will shift with subsequent trading.
On the downside, $47.57 is the primary level to watch. If it holds this level and reclaims $59–$63, the short-term outlook could improve; however, if the daily close falls below $47.57, focus will shift to whether a new stabilization zone emerges.
Recommended Articles


