

Dogecoin Price Forecast: DOGE tests $0.0800 support level amid ETF outflows

Source Fxstreet
  • Dogecoin ticks higher on Tuesday, bouncing off the $0.0800 low after a 5% decline the previous day.
  • The meme coin is losing institutional demand, with DOGE ETFs recording nearly $400,000 in outflows on Monday.
  • The technical outlook for DOGE suggests downside risk as selling pressure mounts at the $0.0800 support level.

Dogecoin (DOGE) price ticks higher at press time on Tuesday, showing signs of a rebound from the $0.0800 low earlier in the day and the previous day’s 5% decline. DOGE-focused Exchange Traded Funds (ETFs) are facing selling pressure, with nearly $400,000 in outflows on Monday, weighing on the meme coin. Dogecoin risks a decline of over 15% to the $0.0683 support level if prices break below $0.0800.

ETF outflows weigh on DOGE

Dogecoin is losing institutional confidence as the broader cryptocurrency market sees capital rotation to Real-World Assets (RWAs) and Decentralized Finance (DeFi) tokens. DOGE-focused ETFs recorded $399,460 in outflows on Monday, down from net-zero inflows last week, suggesting rising selling pressure driven by investor redemptions. 

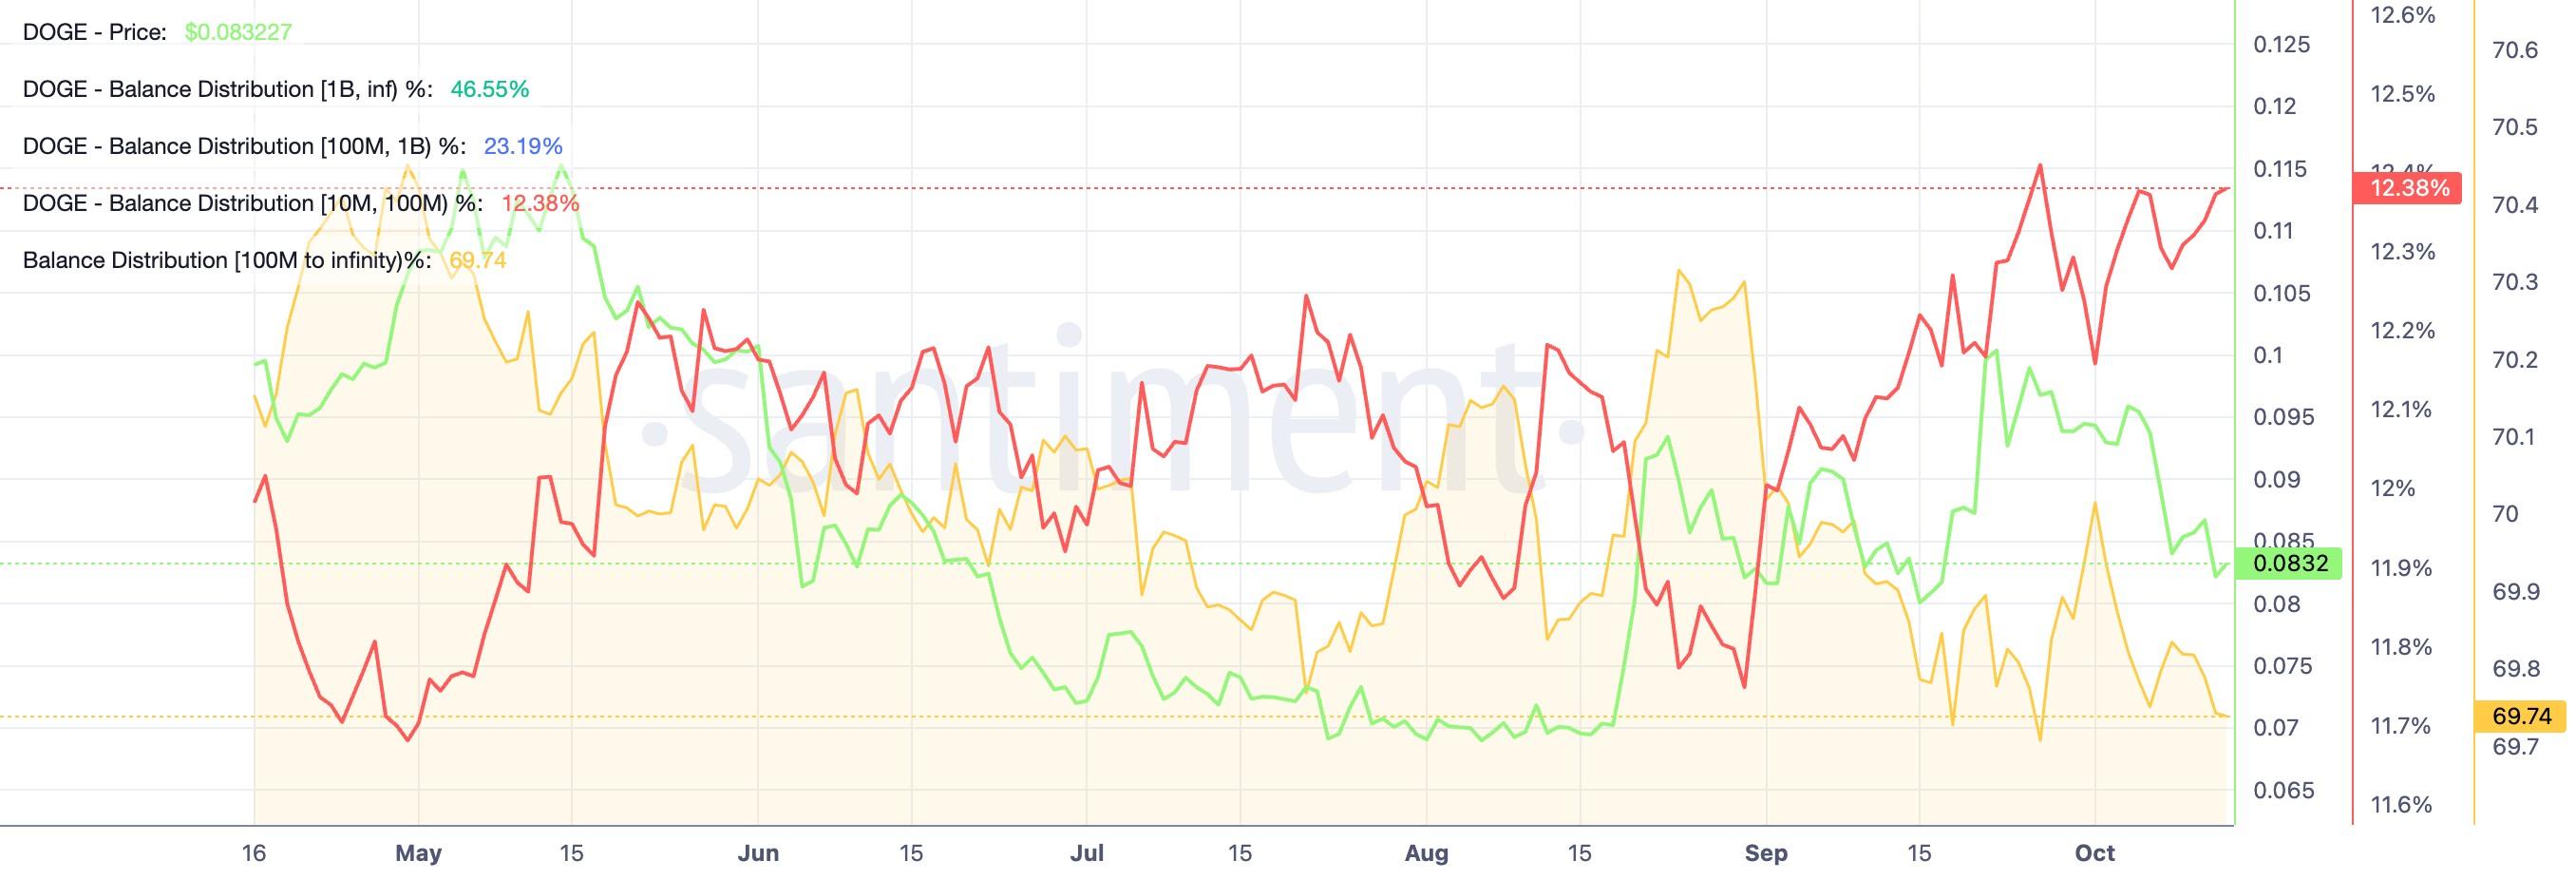
On the other hand, large wallet investors, commonly referred to as whales, holding DOGE are reducing their holdings. Santiment data shows that cohorts with more than 100 million DOGE now hold 69.74% of circulating supply, down from 70.02% on September 1. This indicates a near-term reduction in risk appetite among whales, weighing on the meme coin.
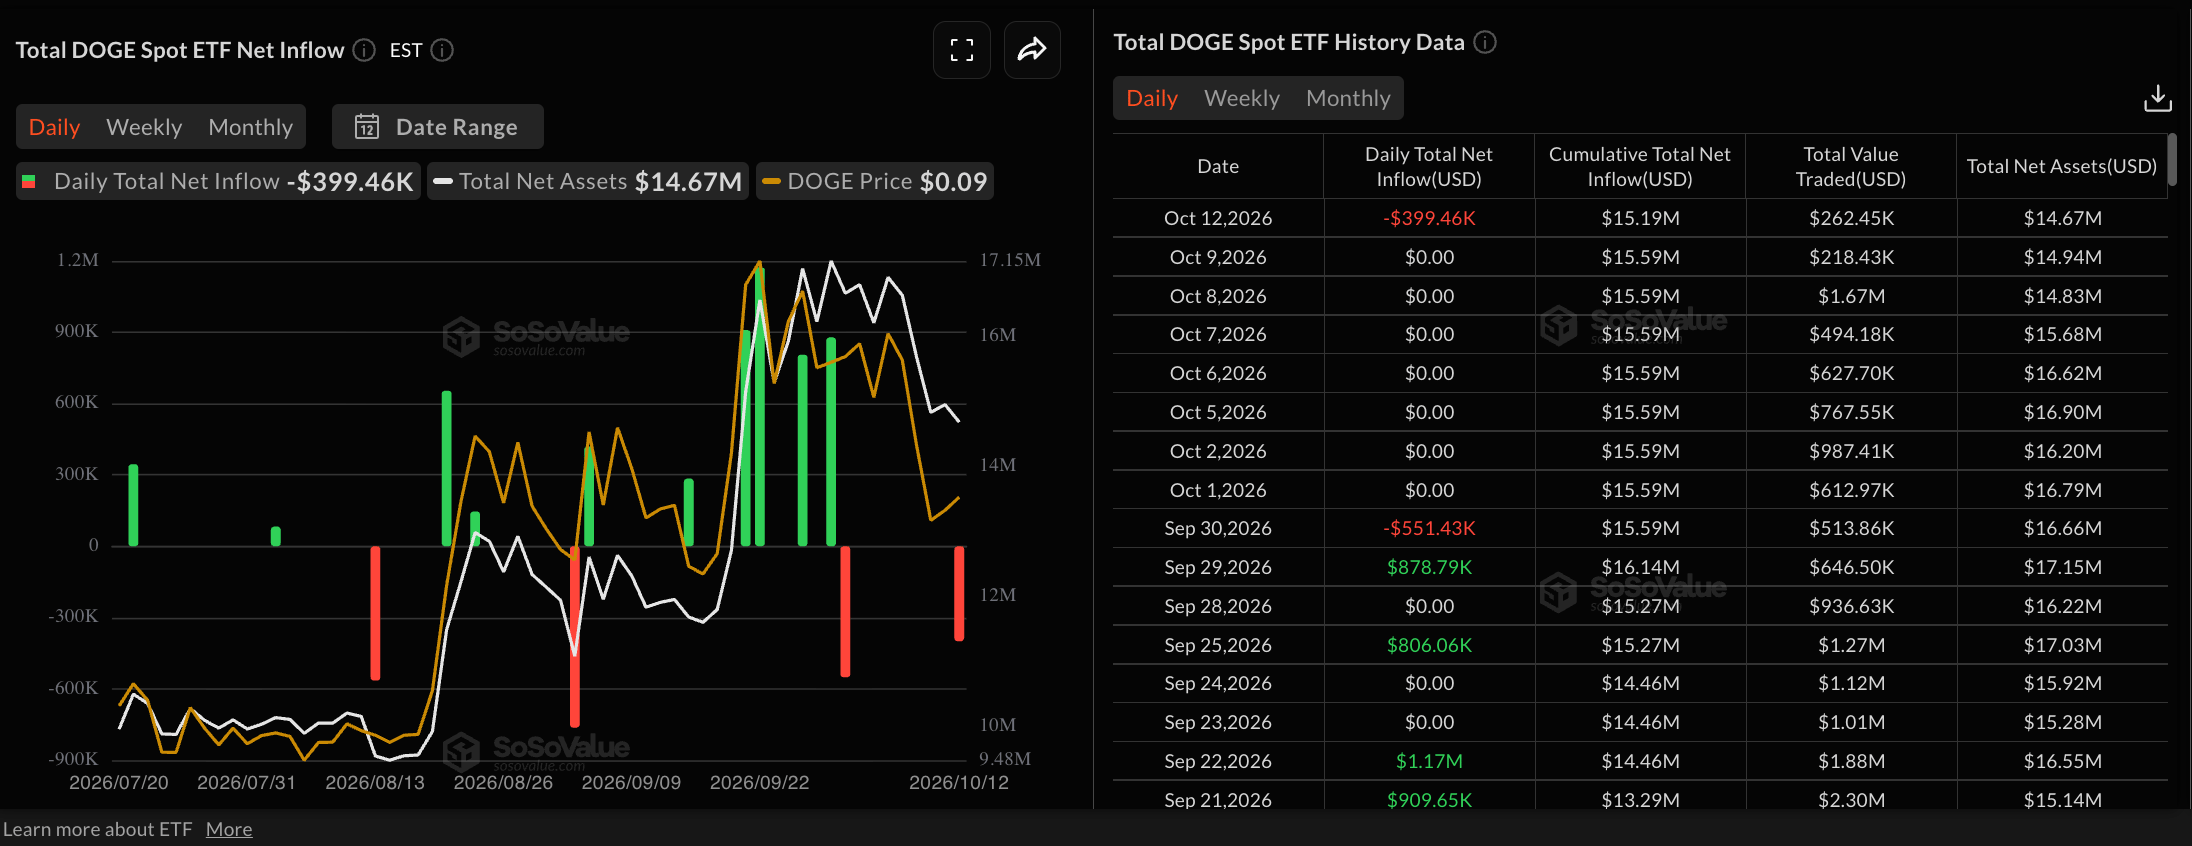
DOGE ETFs data. Source: Sosovalue
DOGE supply distribution data. Source: Santiment

Technical outlook: Will DOGE price hold the fort at $0.0800?

Dogecoin hovers around $0.0829 at press time on Tuesday, keeping a bearish near-term bias. The meme coin price holds below both the 50-day Exponential Moving Average (EMA) at $0.0876 and the 200-day EMA at $0.0923, reinforcing a bearish backdrop.

The Moving Average Convergence Divergence (MACD) crosses below zero, hinting at persistent downside pressure, while the Relative Strength Index (RSI) hovers near 39, approaching oversold territory.

Looking down, a confirmed breakout below the $0.0800 support level, set by the February 6 low, could extend the decline toward the July 23 low at $0.0683, hinting at over 15% downside risk

Chart Analysis DOGE/USDT (Binance)
DOGE/USDT daily price chart.

On the topside, initial resistance is located at the 50-day EMA around $0.0876, with a stronger cap seen at the 200-day EMA near $0.0923, where sellers could reassert control on any rebound.

(The technical analysis of this story was written with the help of an AI tool. Know more.)

Disclaimer: For information purposes only. Past performance is not indicative of future results.
placeholder
Gold Price Analysis Today: Gold Rebounds After 1.91% Drop as Yields Ease. Is $4,449 Next? Gold fell about 1.91% on August 18 before producing a strong bullish reaction from the 1-hour demand zone in early August 19 trading. RSI is recovering from oversold conditions, but Supertrend remains bearish as traders await the Fed minutes.
Author  Naoufal Seddik
Aug 19, Wed
Gold fell about 1.91% on August 18 before producing a strong bullish reaction from the 1-hour demand zone in early August 19 trading. RSI is recovering from oversold conditions, but Supertrend remains bearish as traders await the Fed minutes.
placeholder
Gold Price Analysis Today: Gold Gains 0.94% as Markets Expect Fed to Hold Rates, Can $4,449 Resistance Break? Gold gained 0.94% on August 17, closing near $4,417.30 as softer US data strengthened expectations for unchanged Fed rates in September. Gold remains bullish, with $4,449.730 resistance and $4,310.650 support in focus.
Author  Naoufal Seddik
Aug 18, Tue
Gold gained 0.94% on August 17, closing near $4,417.30 as softer US data strengthened expectations for unchanged Fed rates in September. Gold remains bullish, with $4,449.730 resistance and $4,310.650 support in focus.
placeholder
Gold Price Analysis Today: Gold Drops 1.32% Despite Lower Fed Rate-Hike Bets, Can $4,313 Support Hold? Gold fell 1.32% on August 13 after rising to $4,449.73, then reversing lower and closing near $4,349.918 below the $4,356.46 support. Softer US inflation data reduced Fed rate hike expectations, but selling pressure still dominated the session. Will $4,313 support hold?
Author  Naoufal Seddik
Aug 14, Fri
Gold fell 1.32% on August 13 after rising to $4,449.73, then reversing lower and closing near $4,349.918 below the $4,356.46 support. Softer US inflation data reduced Fed rate hike expectations, but selling pressure still dominated the session. Will $4,313 support hold?
placeholder
XAUUSD Gold Analysis: Gold Holds Above $4,350 Ahead of US Inflation Data Is $4,500 Next? Gold holds above $4,350 following weak US jobs data. As inflation reports approach and UBS eyes $5,000, can XAUUSD break resistance at $4,435 to rally toward $4,500?
Author  Naoufal Seddik
Aug 12, Wed
Gold holds above $4,350 following weak US jobs data. As inflation reports approach and UBS eyes $5,000, can XAUUSD break resistance at $4,435 to rally toward $4,500?
placeholder
Intel Price Forecast: Nvidia Picked Xeon 6, Invested $5B, Yet Analysts Still Trail INTCIntel Corporation (NASDAQ: INTC) sits at $140.05, holding firm on the ascending trendline within the 2H timeframe. The RSI indicator is currently reading 55.21, positioning it as neutral-
Author  TradingKey
Jul 02, Thu
Intel Corporation (NASDAQ: INTC) sits at $140.05, holding firm on the ascending trendline within the 2H timeframe. The RSI indicator is currently reading 55.21, positioning it as neutral-
Related Instrument
goTop
quote