


Prediction: This Is Where the S&P 500 Will Finish 2026
Key Points
The stock market may be overdue for a pullback in the coming months.
Concerns about interest rates, the ongoing war in Iran, and inflation could prompt investors to exercise greater caution.
To reduce risk, investors should re-evaluate their portfolios and consider selling overpriced stocks.
- 10 stocks we like better than S&P 500 Index ›
The S&P 500 (SNPINDEX:^GSPC) is up over 14% this year, as it's on track for another above-average performance. Historically, its annual returns are typically around 10%. This would be the fourth consecutive year that it's outperformed its long-run average.
However, I think there will be some softness in the months ahead. By the end of the year, I predict it'll finish below 7,500. That would still be a near-10% gain from last year, when it finished at around 6,845. But I don't think that the conditions will remain this rosy for long. Here's why.
Missed Nvidia in 2009? This Rare Signal Is Flashing Again. In 2009, a "Double Down" signal flashed for a little-known chipmaker called Nvidia. For the first time in years, that same "Total Conviction" signal is flashing for a company 1/100th the size of Nvidia. Continue »

Image source: Getty Images.
Headwinds are looming
The remaining months of 2026 could add considerable adversity to the markets. There's the possibility that another rate hike will happen. And even if it doesn't, investors may price in the likelihood of another increase before the year is over. That's one factor that could weigh down the S&P 500.
There are also the upcoming midterm elections taking place in November. Odds are, the Democrats will win back control of at least the House or Senate. Historically, the losing party in the federal election does better in the midterms. If that happens and Democrats control at least one chamber of Congress, that would make it much more difficult for the president to pass bills, and thus create more uncertainty heading into 2027.
Lastly, I also don't believe the war in Iran will come to an end by the end of the year. That makes it likely that inflation will remain elevated and that expectations for rate hikes will remain high heading into the new year.
Combined, those factors could significantly weigh on the markets heading into the final months of the year, and could send the S&P 500 below 7,500, with the decline potentially extending into 2027 as well.
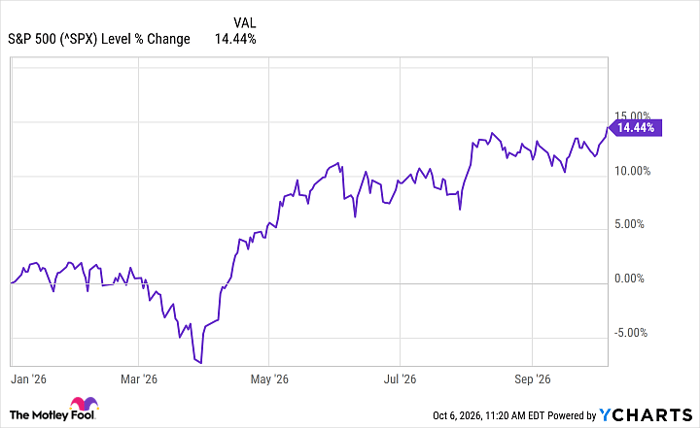
^SPX data by YCharts
Now is a time for investors to re-evaluate their portfolios
The stock market has been running hot for multiple years, and a pullback, potentially even an all-out crash, looks overdue. Many stocks could experience significant declines, but especially those that are priced at significant premiums could be vulnerable. This is why it can be a crucial time for investors to take a closer look at their portfolios and consider taking profits on high performers and shift money into safer investment options, including dividend stocks, value stocks, or simply tracking the market via index funds.
For investors to reduce their risk and exposure to a potential market downturn, it's crucial to consider stock valuations.
Should you buy stock in S&P 500 Index right now?
Before you buy stock in S&P 500 Index, consider this:
The Motley Fool Stock Advisor analyst team just identified what they believe are the 10 best stocks for investors to buy now… and S&P 500 Index wasn’t one of them. The 10 stocks that made the cut could produce monster returns in the coming years.
Consider when Netflix made this list on December 17, 2004... if you invested $1,000 at the time of our recommendation, you’d have $364,023!* Or when Nvidia made this list on April 15, 2005... if you invested $1,000 at the time of our recommendation, you’d have $1,467,933!*
Now, it’s worth noting Stock Advisor’s total average return is 948% — a market-crushing outperformance compared to 214% for the S&P 500. Don't miss the latest top 10 list, available with Stock Advisor, and join an investing community built by individual investors for individual investors.
See the 10 stocks »
*Stock Advisor returns as of October 6, 2026.
David Jagielski, CPA has no position in any of the stocks mentioned. The Motley Fool has no position in any of the stocks mentioned. The Motley Fool has a disclosure policy.
Recommended Articles


