


Strategy Stock Forecast: 848,000 BTC and $20.9 Billion Q3 Gain Put Capital Structure in Focus
Strategy Inc. (NASDAQ: MSTR) forms a MicroStrategy (MSTR) update with the price of Bitcoin rising and the digital asset giant’s large treasury back above quarter-end cost. The stock closed at $164.43 on October 5, up 2.76% on the day. The latest SEC filing filed on October 5, with Bitcoin holdings reported as of October 4, disclosed that Strategy held 848,000 Bitcoin at an aggregate cost of approximately $63.97 billion, an average cost of $75,441 per Bitcoin.
What I find interesting is that Strategy’s investment case is moving away from just owning more Bitcoin and more around the efficient financing of that ownership case. The core of the strategy remains owning more Bitcoin. However, along with that, the financing and capital structure of the company have gained center stage. The core of the financing structure remains common stock. However, along with that Strategy has used prefer- stock, cash and repurchases of preferred stock. For common stock shareholders of MSTR, the key question is whether the improvement in Bitcoin exposure per share can continue after accounting for dilution and the preferential claims in the capital structure.
Strategy Adds Another 334 Bitcoin
On October 1 - 4, Strategy purchased 334 BTC for $28.7 million, for an average cost of $85,838.80 per BTC. This increased their total holdings from 847,666 BTC (as of September 30) to 848,000 BTC (as of October 4). According to Strategy’s own Bitcoin Ledger, their blended cost per BTC is approximately $75,441.
The financing mix is important. Strategy reported that $15.7 million of net proceeds from MSTR common-stock sales helped fund the Bitcoin purchase, with the remaining $13.0 million coming from USD Cash. As of September 30, approximately $18.84 billion of MSTR common stock remained available for issuance under the company’s at-the-market program.
The recent small Bitcoin purchase does not indicate a change to their accumulation strategy, but may suggest that capital is being deployed across multiple objectives. Visible Capital is being deployed for Preferred Stock support and Liquidity management, in addition to Bitcoin purchases.
STRC Repurchases Are Becoming a Bigger Capital-Allocation Tool
Between September 28 and October 4, Strategy spent about $176.3 million repurchasing STRC, its variable-rate perpetual preferred stock. About $102.6 million of STRC was repurchased prior to quarter-end, and another $73.7 million was repurchased between October 1 and October 4. During the same time period, Strategy spent $28.7 million to purchase new Bitcoins.
Management said preferred stock repurchases are part of Strategy’s capital allocation framework and preferred stock is designed to trade near its $100 stated amount. Repurchases can improve liquidity in the market and reduces the obligation to pay future dividends at a discount. Management also increased the dividend rate on STRC to 12% for the 2026 dividend period, which, makes the market functionally important.
Preferred stock is not free financing, and preferred stock repurchases can improve the capital structure, however, reliance on preferred stock financings increases the amount of capital that must be generated or raised before common shareholders receive residual value.
Q3 Produces a $20.91 Billion Digital-Asset Gain
Strategy estimates a gain of $20.91 billion from its digital assets for the third quarter. The Company also expects approximately $1.88 billion of associated deferred tax expense and reported a digital asset carrying value of $70.82 billion at September 30. These amounts are management estimates and have not been audited or reviewed by KPMG at the time the report was filed.
It is important to understand the accounting mechanics. The $20.91 billion is the estimated digital-asset fair-value gain. Separately, Strategy reversed the $4.12 billion deferred tax asset that existed at the end of Q2 and released the related valuation allowance. That release produced an approximately $4.12 billion income-tax benefit, reducing estimated deferred tax expense from about $6.00 billion to $1.88 billion.
As such, the usefulness of conventional earnings per share metrics has become even more limited for MSTR. Large swings in quarter-to-quarter digital asset prices can obfuscate the operating results of the software business and dramatically impact net income or loss. I prefer the metrics of the Company’s Bitcoin Holdings, Bitcoin on a per diluted share basis, capital raised, preferred obligations and the size of the company’s liquidity buffer.
The Software Business Is Financially Secondary
Although the software division is still a real business, it is financially smaller compared to the Bitcoin treasury. In Q2, total revenue was $122.4 million, up 6.9% year over year. Gross profit was $81.6 million and a gross margin of 66.6%. The company reported an operating loss of $8.33 billion and a net loss of $8.22 billion due to the drop in fair value of Bitcoin.
Software valuation is becoming increasingly irrelevant for MSTR. Even a strong quarter from enterprise analytics cannot offset a large Bitcoin fair-value move, and a substantial Bitcoin rally can make earnings look impressive, but not create comparable operating cash flow.
Therefore, I would take the software business as a secondary source of revenue, and strategic identity. The larger economic exposure is from the Bitcoin treasury and other securities which Strategy uses to finance it.
Strategy Builds a $5.7 Billion Dollar Liquidity Cushion
On October 4, Strategy had a USD Reserve of $4.88 billion and $833.4 million of USD Cash, for a total of approximately $5.71 billion of liquidity in dollars. The reserve is primarily to support preferred dividends and debt service. Cash can be used to purchase Bitcoin, build the reserve and/or for general capital management.
From September 28 through October 4, Strategy used $154.1 million of cash to repurchase STRC preferred stock and $13.0 million to purchase Bitcoin. The company also used $142.5 million of the reserve to pay preferred dividends and interest on outstanding debt.
The larger reserve reduces near-term risk around preferred dividends and debt interest. Because preferred dividends and debt service are cash obligations, it reduces liquidity risk for the company. The larger reserve also affords management the ability to be more flexible in avoiding Bitcoin sales to meet cash needs. That is positive for common shareholders.
Daily Dividend Proposal Needs Careful Framing
On October 5, Strategy filed a definitive proxy asking MSTR shareholders to approve amendments that would move STRF, STRC, STRK and STRD to daily dividend record dates, with each declared dividend payable on the next business day. The meeting has been set for October 28. If the changes are approved, STRC’s first daily record date would be November 1 with payment on November 2, while STRF, STRK and STRD would begin the daily cadence with January 1 record dates and January 4 payments.
The proposal changes the payment cadence, not merely the accounting accrual. STRC would move from semi-monthly payments to daily payments, while STRF, STRK and STRD would move from quarterly payments to daily payments. Each calendar day would serve as a record date, with the related declared dividend payable on the next business day.
Daily accrual, according to management, benefits Reinvestment Economics and Price Stability of the securities, as well as Liquidity. For MSTR shareholders, the focus should be on whether improving the Preferreds Market benefits Strategy and reduces Strategy’s Cost of Capital to the point where preferred financing is more accessible and less reliant on common stock issuance.
Bitcoin Per Share Is the Metric That Matters Most
Strategy Inc. itself, not a separate fund, owns the 848,000 BTC disclosed as of October 4. The 848,000 BTC figure is the company’s aggregate Bitcoin holding, not a partial fund position.
Bitcoin per share, not absolute BTC, is the metric investors should really care about. Strategy defines Net Bitcoin Per Share using Net BTC divided by Fully Diluted Shares Outstanding, after accounting for certain senior claims net of USD assets. Management has the power to raise additional equity and/or introduce preferred equity to fund the strategies and activities of the company. Overall, the company will have to decide if issuing new securities to acquire Bitcoin at a premium is a better strategy than diluting shares and/or raising new equity. Because of the company’s mixed strategy, and the common nature of preferred share issuance, the valuation model becomes less favorable.
I see that Strategy has put greater weight on Net Bitcoin Per Share, indicating that, eventually, just buying more Bitcoin is not going to be enough. The method of financing will ultimately determine whether common shareholders are more exposed to Bitcoin on a per-share basis.
Valuation Still Depends on Bitcoin and the Capital Structure
Through the October 5 close, the market capitalization and enterprise value for Strategy were around $63.2 billion and $67.5 billion, respectively. The stock’s beta is around 3.6, making it one of the higher volatility public market proxies for Bitcoin. Given the high volatility of the stock, traditional valuation ratios do not apply.
For the next quarterly report, I will pay far less attention to software EPS and pay much more attention to Bitcoin per diluted share, as well as MSTR issuance, preferred-stock dividend obligations, the performance of STRC, the USD Reserve, the continued increase in the BTC treasury, and the potential weakening of the residual claim for common shareholders.
Strategy Technical Analysis: MSTR Holds Rising Trendline as Bulls Target $170.89
Strategy closed Monday’s session at $164.43, rebounding from the $153 to $156 support area. Strategy has been holding above both of the major moving averages, and more importantly, has been holding and respecting the rising trendline. The recent sequence of higher lows indicates that buyers are working to reassert their control to re-test resistance once again.
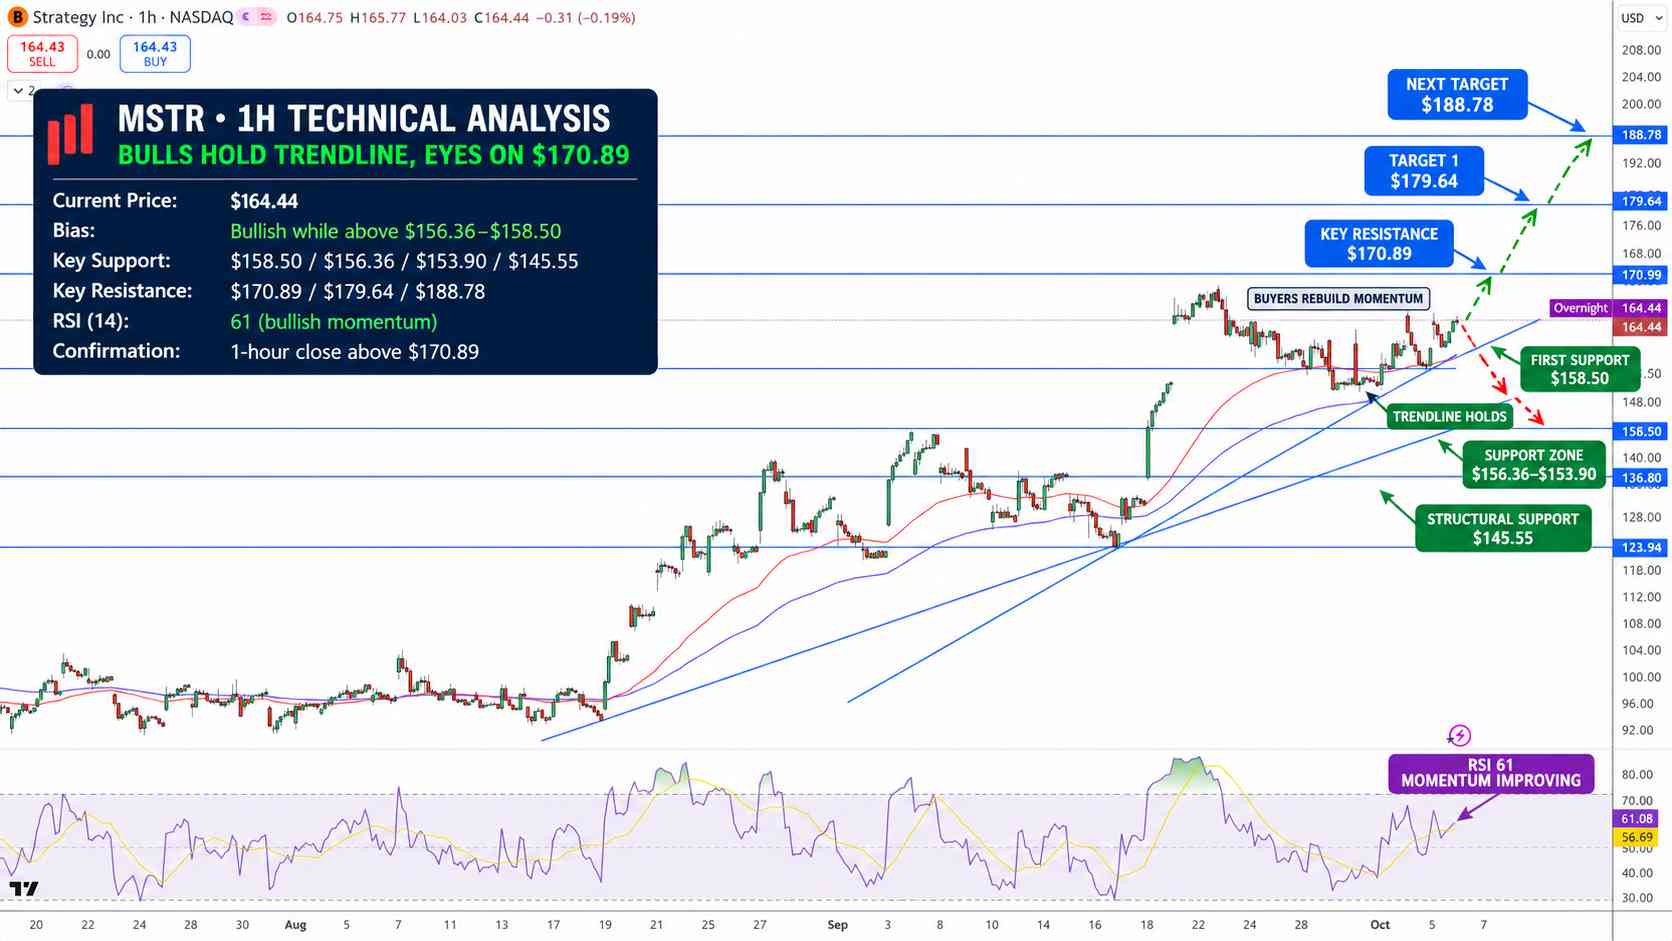
Strategy Stock Price Chart - Source: Tradingview
RSI is at about 61, and is above the signal line at 57. It is also well above the neutral 50 level. The above mentioned factors all indicate a bullish scenario. The next major resistance area is at $170.89.
A bullish breakout and close above $170.89 would open up $179.64. Higher still, $188.78 could come into view. Initial important support rests at $158.50 to $156.36, and is followed by the longer term moving average at $153.90 and the rising trendline.
My base case is bullish so long as MSTR trades above $158.50.
Key Levels
- Latest Close: $164.43
- Major Support: $158.50 to $156.36, $153.90, $145.55
- Major Resistance: $170.89, $179.64, $188.78
- RSI: approx. 61 (bullish)
- Breakout Level: Bullish break of $170.89 targeting $179.64.
Why is Strategy stock in focus now?
In addition to the recent change in Bitcoin price, which created an approximate $20.91 billion digital-asset fair-value gain in Q3 for MSTR’s Bitcoin exposure, management has taken multiple actions using common equity, preferred equity, cash, and the company’s preferred stock buyback, to optimize the capital structure. Hence the focus is increasingly on capital structure and Bitcoin price.
What level confirms a stronger MSTR breakout?
A sustained break of $170.89 would increase the likelihood of a move to $179.64. A break of $156.36 reduces the likelihood of the bullish case and increases the focus on $153.90 and $145.55.
Bottom Line
In October, Strategy has its Bitcoin treasury back above cost at quarter-end and an improved dollar-liquidity position than earlier in the year. It is now long 848,000 BTC and the Q3 fair-value rebound of Bitcoin caused a digital-asset gain of approximately $20.91 billion. Preferred stock obligations, as well as common share issuance, increase the structure's complexity.
The key metric for me is not the amount of Bitcoin long BTC Strategy holds. It is the amount of Bitcoin exposure that the long common share Strategy holds after preferred share claims and financing costs. The long common share Strategy remains constructive above $156.36 to $158.50. Fundamentally, the long-term case for the Strategy is the continued ability of the company to raise capital on terms that increase Bitcoin exposure faster than they dilute common shareholders and add financing costs.
Recommended Articles


