


Midterm Elections Are One Month Away: Almost a Century of History Says This Would Be the Best Outcome for Stocks
Key Points
Midterm elections on Nov. 3 could shake up Wall Street’s rip-roaring bull market under President Donald Trump.
Since 1923, a unified Republican government has delivered the second-highest average annual stock market returns.
No matter how the political puzzle pieces are arranged, the stock market is unwavering in its ability to create wealth over long periods.
- 10 stocks we like better than S&P 500 Index ›
For the better part of the six years President Donald Trump has been in the White House, stocks have thrived. The annualized return of the timeless Dow Jones Industrial Average (DJINDICES:^DJI), benchmark S&P 500 (SNPINDEX:^GSPC), and tech-powered Nasdaq Composite (NASDAQINDEX:^IXIC) is higher under Trump than under most other presidents over the last 130 years.
But from a historical standpoint, stock market returns can accelerate or fall off a cliff based on the makeup of Congress. Though not every bill passed by Congress and signed into law by the president impacts Wall Street, our elected officials are ultimately responsible for fiscal policy, which does impact corporate America.
Missed Nvidia in 2009? This Rare Signal Is Flashing Again. In 2009, a "Double Down" signal flashed for a little-known chipmaker called Nvidia. For the first time in years, that same "Total Conviction" signal is flashing for a company 1/100th the size of Nvidia. Continue »
Exactly one month from today, on Nov. 3, Americans across the country will go to the polls or mail in their ballots for Election Day. Based on what history says, there's one very clear scenario that would be the best outcome for stocks on Nov. 3. But according to prediction markets, the worst-case scenario may unfold.

Election Day is one month from today. Image source: Official White House Photo by Joyce N. Boghosian, courtesy of the National Archives.
Midterm elections may yield a worst-case scenario for stocks
In the first two years of President Trump's non-consecutive terms, he's overseen a unified government, with the U.S. Senate and House of Representatives controlled by Republicans. The GOP currently holds 53 of 100 Senate seats and 218 of 435 seats in the House.
Unified governments are favored by sitting presidents because it's a lot easier to pass major legislation and keep campaign promises.
For instance, Republican control of both houses of Congress proved instrumental to the passage of the Tax Cuts and Jobs Act (TCJA) in December 2017. This tax and spending law permanently lowered the peak marginal corporate income tax rate from 35% to 21% -- the lowest level since 1939. With businesses retaining more of their income, stock buybacks skyrocketed, boosting earnings per share.
President Trump took advantage of a unified Congress last year to pass a second major tax overhaul, the "Big, Beautiful Bill." This legislation made the TCJA's personal tax brackets permanent and introduced a bevy of temporary tax breaks from calendar years 2025-2028.
But similar to Donald Trump's first term as president, the second half of his second term is expected to feature a divided Congress.
61% chance Democrats sweep the midterms. https://t.co/ZVG6ezlEiP
— Polymarket (@Polymarket) September 18, 2026
According to traders on prediction market Polymarket as of Sept. 28, there's just an 8% chance that Republicans sweep the midterm elections and retain control of both houses of Congress. By comparison, there's a 61% probability that Democrats retake both houses, and a 31% chance that Republicans hold the Senate and Democrats retake the House.
Based on nearly a century of history (1926-2023), researchers at retirement education platform Retirement Researcher calculated the average annual return of the benchmark S&P 500 based on whether a Democrat or a Republican was president and whether Congress was unified or split. Here are the results:
- Democratic president with a split Congress: 16.63% average annual return over 15 years
- Unified Republican: 14.52% average annual return over 13 years
- Unified Democrat: 14.01% average annual return over 36 years
- Republican president with a split Congress: 7.33% average annual return over 34 years.
Given that Donald Trump's term ends in January 2029, the best outcome for stocks, from a purely historical standpoint, would be a Republican sweep on Nov. 3. Though it's the smallest sample size, unified GOP governments have overseen the second-highest returns over 98 years.
However, the odds of a Republican sweep are quite low, per prediction markets. If Democrats retake the House and/or Senate, stocks will be facing the historical worst-case scenario: a 7.33% average annual return.

Image source: Getty Images.
Even historical worst-case scenarios aren't that bad for investors
The stock market's one historical outlier in average annual returns, a Republican president overseeing a divided Congress, is difficult to explain. While it can be argued that political gridlock unnerves investors, a Democratic president overseeing a divided Congress has delivered the highest average annual returns since 1926.
Debt-ceiling concerns might also explain this underperformance. It's a lot easier for a unified government to raise the debt ceiling than it is for a split Congress.
Whatever the reasons are behind this underperformance, it's imperative that investors maintain perspective. While history tells us that a Republican president with a split Congress delivers the lowest average annual return, a 7.33% yearly gain for the S&P 500 is still notably higher than the average annual long-term returns of gold, silver, oil, real estate, and Treasury bonds.
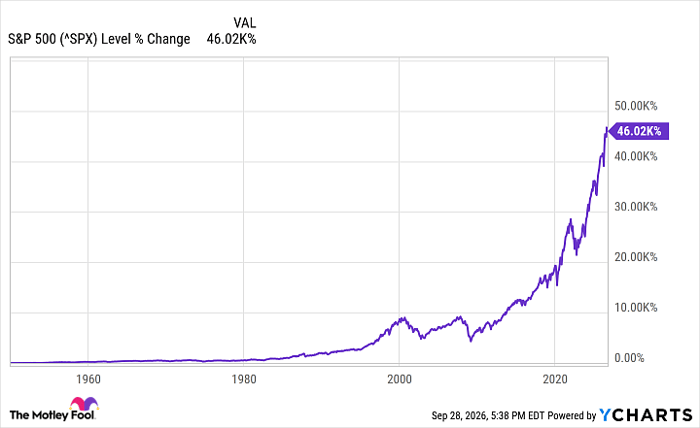
Perhaps most importantly, Retirement Researcher's data affirms that no matter how the puzzle pieces are arranged, the stock market is unwavering in its ability to create wealth over long periods.
^SPX data by YCharts
Earlier this year, analysts at Crestmont Research refreshed a data set that examines the rolling 20-year total returns, including dividends, of the broad-based S&P 500 since 1900. Even though the S&P didn't exist until 1923, researchers were able to track the performance of its components in other major indexes back to 1900.
Crestmont's data yielded 107 unique rolling 20-year periods (1900-1919, 1901-1920, and so on, through 2006-2025), all of which produced a positive average annual return. In other words, no matter what obstacle presented itself -- recession, depression, pandemic, war, high inflation, oil embargo, banking crisis, or an unfavorable congressional makeup -- the stock market always gained after 20 years.
Even if a worst-case scenario is setting up for the stock market with midterm elections, history says long-term investors are still sitting pretty.
Should you buy stock in S&P 500 Index right now?
Before you buy stock in S&P 500 Index, consider this:
The Motley Fool Stock Advisor analyst team just identified what they believe are the 10 best stocks for investors to buy now… and S&P 500 Index wasn’t one of them. The 10 stocks that made the cut could produce monster returns in the coming years.
Consider when Netflix made this list on December 17, 2004... if you invested $1,000 at the time of our recommendation, you’d have $361,650!* Or when Nvidia made this list on April 15, 2005... if you invested $1,000 at the time of our recommendation, you’d have $1,437,517!*
Now, it’s worth noting Stock Advisor’s total average return is 936% — a market-crushing outperformance compared to 211% for the S&P 500. Don't miss the latest top 10 list, available with Stock Advisor, and join an investing community built by individual investors for individual investors.
See the 10 stocks »
*Stock Advisor returns as of October 3, 2026.
Sean Williams has no position in any of the stocks mentioned. The Motley Fool has no position in any of the stocks mentioned. The Motley Fool has a disclosure policy.
Recommended Articles


