


VIG's Strange Rule: The Highest-Yielding Dividend Growers Aren't Allowed In
Key Points
One of the criticisms of the Vanguard Dividend Appreciation ETF is that it offers a relatively low yield.
That's actually by design.
The fund actively avoids high-yield stocks, but that works for its overall strategy.
- 10 stocks we like better than Vanguard Dividend Appreciation ETF ›
The Vanguard Dividend Appreciation ETF (NYSEMKT: VIG) is the largest dividend exchange-traded fund (ETF) in the world. Its advantage is its simplicity. It targets companies that have raised their annual payouts for at least 10 consecutive years and adds those stocks that qualify under its criteria to its portfolio on a market-cap-weighted basis.
For dividend growth investors, it's a simple yet effective strategy that's returned an average of 10.2% annually since its 2006 inception.
Missed AI’s "Act 1"? Act 2 Could Be 15x Bigger. Most investors think they missed the AI boat because they didn't buy Nvidia in 2005. But according to our analysts, we’re only at the end of "Act 1"—the R&D phase. "Act 2" is the global rollout. Continue »
But its stock selection criteria don't end with the payout-hiking streak. The Vanguard Dividend Appreciation ETF's index also ranks eligible companies by indicated annual dividend yield and eliminates the highest-yielding 25% of stocks.
In other words, if a stock's yield is too high, it's out.
Which begs the question: Why would a dividend-growth ETF deliberately refuse to own the highest-yielding stocks that would otherwise qualify for inclusion?

Source: Getty Images.
VIG doesn't necessarily want the biggest yield
The answer is surprisingly intuitive.
People invest in long-term dividend growth stocks because they're looking for predictability. They know these companies have track records of raising their payouts consistently, and investors build that slow growth of income into their financial plans.
In a lot of cases, feeling confident in future dividend growth to help preserve the purchasing power of their dividend income is the primary goal of these folks. They're not necessarily looking for huge yields. They're looking for stability and annual payouts that will grow at a pace that stays ahead of the inflation rate.
The higher-yielding stocks could be what are known as "yield traps." These are stocks whose dividend yields have risen because their share prices have fallen. And a stock can fall for a host of reasons, including problems with the underlying business that can lead to dividend cuts. Yield traps are often underperformers with unpredictable dividend schedules.
That's important to consider because it clarifies the intention of the Vanguard Dividend Appreciation ETF's index. Its focus is on consistent dividend growth, not yield.
The fund's current dividend yield of 1.4% should make that obvious. But look at this dividend distribution history over the past 20 years.
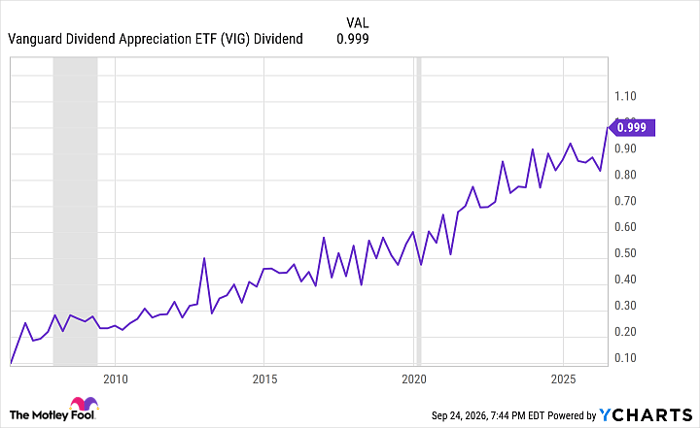
VIG Dividend data by YCharts.
That's the kind of steady uptrend you want to see if you're counting on annual payout increases from your income investments. The yield you start with may not get investors excited. But the Vanguard Dividend Appreciation ETF is doing exactly what it should.
VIG's investment case is clear
The takeaway for investors is pretty straightforward.
This fund is for investors looking for growth of portfolio income. It won't appeal to those looking for high yield. In fact, the fund goes out of its way to avoid the latter in order to focus on the former.
And that's just fine with me.
Should you buy stock in Vanguard Dividend Appreciation ETF right now?
Before you buy stock in Vanguard Dividend Appreciation ETF, consider this:
The Motley Fool Stock Advisor analyst team just identified what they believe are the 10 best stocks for investors to buy now… and Vanguard Dividend Appreciation ETF wasn’t one of them. The 10 stocks that made the cut could produce monster returns in the coming years.
Consider when Netflix made this list on December 17, 2004... if you invested $1,000 at the time of our recommendation, you’d have $383,680!* Or when Nvidia made this list on April 15, 2005... if you invested $1,000 at the time of our recommendation, you’d have $1,382,954!*
Now, it’s worth noting Stock Advisor’s total average return is 937% — a market-crushing outperformance compared to 214% for the S&P 500. Don't miss the latest top 10 list, available with Stock Advisor, and join an investing community built by individual investors for individual investors.
See the 10 stocks »
*Stock Advisor returns as of September 26, 2026.
David Dierking has positions in Vanguard Dividend Appreciation ETF. The Motley Fool has positions in and recommends Vanguard Dividend Appreciation ETF. The Motley Fool has a disclosure policy.
Recommended Articles


