


Bitcoin (BTCUSD) Is up 1.01% on Oct 4: What Do On-Chain Data and Market Sentiment Show?
Bitcoin (BTCUSD) is up 1.01% at Oct 4 16:40(ET), now at $85572.88, with a 7-day up of 1.24%.
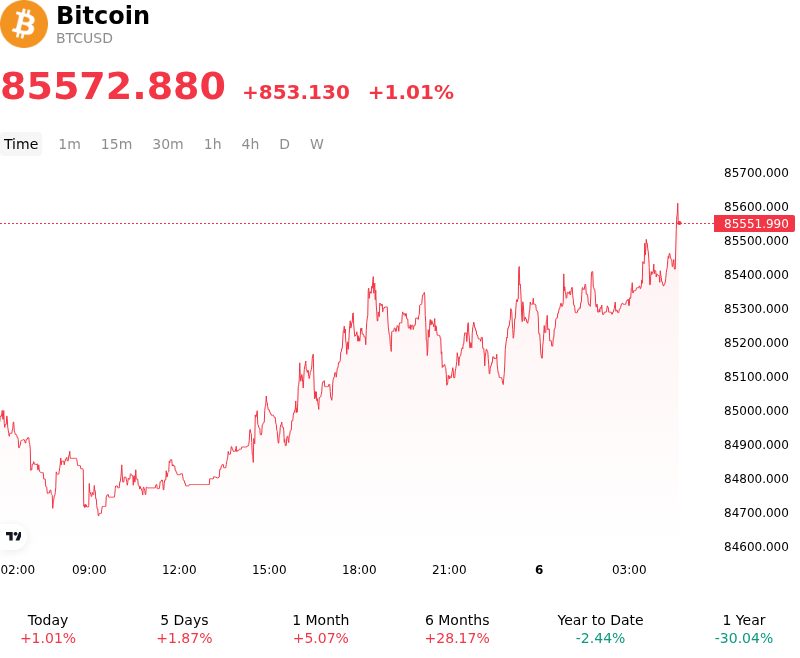
What is driving Bitcoin (BTCUSD)’s stock price up today?
Bitcoin advanced as market participants re-priced macroeconomic liquidity conditions following cooler U.S. labor market indicators, which strengthened expectations of a softer monetary policy stance from the Federal Reserve. A softer economic growth trajectory lowered probabilities of further benchmark rate hikes, curbing upward momentum in U.S. Treasury yields and reducing opportunity costs for holding non-yielding digital assets. As global risk appetite stabilized, capital flows favored benchmark crypto assets, with Bitcoin absorbing a disproportionate share of market liquidity.
Institutional market sentiment received a structural boost following prominent sell-side upward target revisions and ongoing progress in spot ETF capital accumulation. Major Wall Street institutions raised their medium-term price targets, highlighting sustained institutional demand and favorable macro liquidity tailwinds. Concurrently, regulatory framework developments—specifically SEC proposals clarifying institutional digital asset custody for registered investment advisers—further reduced tail risk for long-term allocators, cementing Bitcoin's position as the primary vehicle for institutional crypto exposure.
Market microstructure dynamics highlighted a distinct capital concentration trend, where Bitcoin expanded its market dominance relative to the broader digital asset space. While altcoin breadth remained selective and mixed, inflows remained clustered in top-tier, highly liquid assets. Derivatives positioning remained constructive as leverage flushed out during recent consolidation was replaced by steady spot accumulation and disciplined bid activity above key moving averages, reinforcing an upward bias as the market entered the fourth quarter.
Looking ahead, Bitcoin's upward trajectory remains underpinned by favorable fourth-quarter seasonal liquidity trends, structural spot ETF demand, and expanding corporate treasury adoption. However, institutional investors continue to monitor risks surrounding global inflation volatility, shifting U.S. monetary policy expectations, and potential liquidity contractions in broader capital markets. Maintaining key technical support levels will be essential to sustain institutional buy-side momentum toward higher valuation thresholds.
Technical Analysis of Bitcoin (BTCUSD)
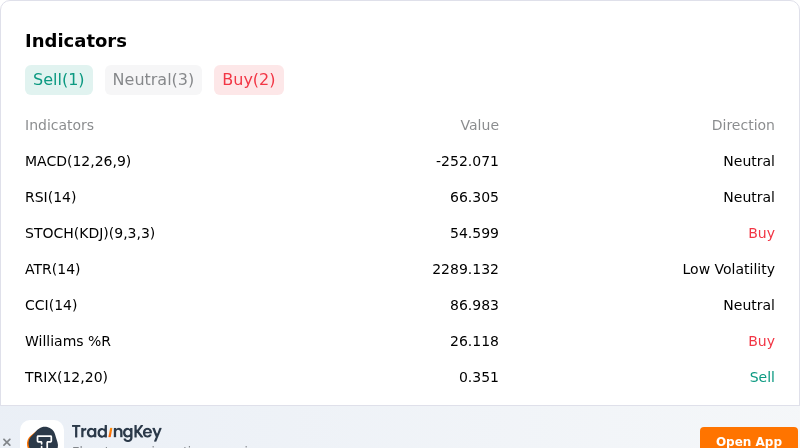
Technically, Bitcoin (BTCUSD) shows a MACD (12,26,9) value of -252.071, indicating a neutral signal. The RSI at 66.305 suggests neutral condition and the Williams %R at 26.118 suggests buy condition. Please monitor closely.
More details about Bitcoin (BTCUSD)
Recent Events and Risks:
- Heavy Overhead Cost-Basis Resistance: Bitcoin's rejection from $87,220 back down to the $84,000–$85,000 range is heavily constrained by an estimated 1.39 million BTC cost-basis cluster between $84,000 and $86,500, creating significant breakeven selling pressure that risks driving prices down toward $81,300 if spot momentum falters.
- Institutional Spot ETF Flow Reversals: U.S. spot Bitcoin ETFs recorded a net daily outflow of $148.69 million, breaking a nine-day inflow streak and signaling that recent upward price action was driven primarily by derivative short squeezes rather than sustained institutional spot buying.
- Macro Headwinds From Elevated Yields and Dollar Strength: Benchmark 10-year U.S. Treasury yields exceeding 5.2% and a strengthening U.S. Dollar Index above 101.8 are tightening financial conditions, reducing investor risk appetite and dampening capital allocation into non-yielding digital assets.
- Elevated Leverage and ETP Liquidation Risk: Rising futures open interest following short squeeze liquidations, combined with the SEC's recent approval of 3x leveraged crypto ETPs, increases market fragility and heightens the risk of violent long-side liquidation cascades if support at $84,800 fails.
Recommended Articles


