


This Unstoppable ETF Is Down 12% From Its High -- and History Says Now Is a Smart Time to Invest
Key Points
The VanEck Semiconductor ETF is up 88% over the past 12 months.
It has dipped about 12% over the past several months.
Yet, it beats just about every ETF out there with its long-term performance.
- 10 stocks we like better than VanEck ETF Trust - VanEck Semiconductor ETF ›
You would have a hard time finding an exchange traded fund (ETF) that has performed better than the VanEck Semiconductor ETF (NASDAQ: SMH) over the years.
Pick a time frame, and the VanEck Semiconductor ETF has outperformed just about any other ETF -- and not just recently but over the long term. The ETF is up 65% year to date and 88% over the past year. No major tech, large-cap, or small-cap ETF comes close to that. And over the past three years, it has generated a staggering 60% average annualized return.
Missed AI’s "Act 1"? Act 2 Could Be 15x Bigger. Most investors think they missed the AI boat because they didn't buy Nvidia in 2005. But according to our analysts, we’re only at the end of "Act 1"—the R&D phase. "Act 2" is the global rollout. Continue »
The outperformance has, of course, been driven by chip stocks, which have been leading the AI revolution and current bull market.

Image source: Getty Images.
It tracks the MVIS US Listed Semiconductor 25 index, which includes the 25 largest, most liquid semiconductor stocks in the world. So when graphics processing unit (GPU) makers like Nvidia and Broadcom were dominating earlier in this bull market, they drove the performance of this ETF, and now it's memory chip stocks like Micron Technology that are fueling the eye-popping results.
But since reaching a 52-week high of $671 per share on June 22, the ETF has dropped about 12% to $593 per share as of Sept. 21. And just a week ago, it had been at $541 per share, down 19% from its recent high. Investors have been piling back in over the past week, buying on the dip. But it is still an excellent opportunity at its current price.
The best performer out there
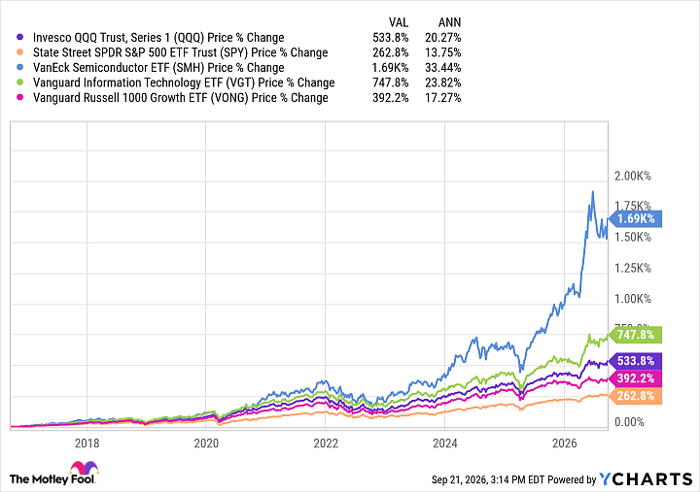
As noted, the VanEck Semiconductor ETF has not just been a peak performer over the past year or three years. Its outperformance goes back to its launch 15 years ago in 2011. Over the past 10 years, it has averaged a 33% annualized return, beating the major tech, growth, and large-cap ETFs.
QQQ data by YCharts
And over the past 15 years, since its inception in December of 2011, it has posted an annualized return of about 29%, also beating its rivals.
The recent 12% to 19% dip is part of the territory with this ETF, which is prone to short-term volatility. Because all two dozen or so of the holdings are chip stocks -- like Nvidia, Taiwan Semiconductor Manufacturing, and Broadcom, its top three holdings -- they will move mostly in tandem when there is a negative catalyst.
But over the long term, those short-term dips have proven to be buying opportunities, given the importance of chip stocks in the digital and AI eras and the accompanying historical returns the ETF has generated.
So when you see the VanEck Semiconductor ETF go through one of its periods of volatility, it should be on your radar to add shares when it temporarily corrects.
However, because it is highly concentrated in one industry within one sector, investors should be careful not to allocate too much of their portfolio to this ETF. Keep it insulated within a diversified portfolio with a relatively small allocation that's balanced out by other assets that tap into different sections of the stock market universe and perform differently in any given market cycle.
Should you buy stock in VanEck ETF Trust - VanEck Semiconductor ETF right now?
Before you buy stock in VanEck ETF Trust - VanEck Semiconductor ETF, consider this:
The Motley Fool Stock Advisor analyst team just identified what they believe are the 10 best stocks for investors to buy now… and VanEck ETF Trust - VanEck Semiconductor ETF wasn’t one of them. The 10 stocks that made the cut could produce monster returns in the coming years.
Consider when Netflix made this list on December 17, 2004... if you invested $1,000 at the time of our recommendation, you’d have $389,154!* Or when Nvidia made this list on April 15, 2005... if you invested $1,000 at the time of our recommendation, you’d have $1,406,303!*
Now, it’s worth noting Stock Advisor’s total average return is 949% — a market-crushing outperformance compared to 214% for the S&P 500. Don't miss the latest top 10 list, available with Stock Advisor, and join an investing community built by individual investors for individual investors.
See the 10 stocks »
*Stock Advisor returns as of September 23, 2026.
Dave Kovaleski has positions in Micron Technology. The Motley Fool has positions in and recommends Broadcom, Micron Technology, and Nvidia. The Motley Fool has a disclosure policy.
Recommended Articles


