


WDC Stock Price Forecast: AI Storage Demand Drives Up HDD Prices, Can Western Digital Return to $500?
TradingKey - On September 22, US Eastern Time, Western Digital (WDC) rose 3.67% to close at $464.60, after reaching an intraday high of $474.39. The stock climbed for the fifth consecutive trading day, rebounding about 12.8% from its September 15 close of $411.96; compared with the intraday high of $799.87 set on June 18, it remains down about 41.9%.
Western Digital completed the spin-off of its flash memory business on February 24, 2025, and the related business is now operated independently by SanDisk (SNDK). Post-spin-off, Western Digital focuses on hard disk drives, with high-capacity Nearline HDDs for cloud service providers and large data centers becoming its main growth driver. AI data centers continue to boost data storage demand, driving cloud customers to expand their HDD procurement.
AI Data Centers Drive HDD Demand as Western Digital Profitability Continues to Improve
Western Digital reported fourth-quarter fiscal 2026 revenue of $3.747 billion, up 44% year-over-year; Non-GAAP gross margin rose from 41.3% in the prior-year period to 54.4%, while adjusted earnings per share grew 109% to $3.56. Operating cash flow and free cash flow were $1.389 billion and $1.281 billion, respectively.
Profit growth was primarily driven by higher HDD shipped capacity, an increased proportion of high-capacity products, price increases, and improved manufacturing efficiency. During the quarter, average selling price per TB achieved high double-digit year-over-year growth, while cost per TB dropped by approximately 8%.
For the first quarter of fiscal 2027, the company expects revenue to be between $4.0 billion and $4.2 billion, Non-GAAP gross margin to be between 55% and 56%, and adjusted earnings per share to range from $3.85 to $4.15. The midpoints of all three guidance metrics exceed actual fourth-quarter levels, reflecting that cloud storage demand, product mix, and pricing continue to support performance.
Most of the cloud business volume is already covered by long-term agreements, with one customer agreement extending through 2029, and the company is negotiating new agreements covering 2029 to 2031. These arrangements enhance volume visibility, though actual pricing remains dependent on the timing of agreement renewals and new product introductions.
On the product front, ePMR hard drives with capacities of up to 40TB have begun shipping, with mass production advancing with two customers; they are expected to account for approximately 50% of Nearline shipped capacity by the third quarter of fiscal 2027.
Western Digital plans to begin shipping 44TB HAMR hard drives in the first half of 2027. The product still needs to complete customer qualification and mass production ramp as scheduled, and the pace of progress will affect the company's competition with Seagate in the ultra-high-capacity hard drive market.
Can the WDC Stock Rally Continue?
WDC's medium-term growth drivers stem from cloud computing and AI data center expansion, tight supply of Nearline HDDs, and rising prices per TB. While hard disk drives do not participate in AI compute, they remain the primary low-cost storage medium for training data, data lakes, logs, and backups.
Management stated that price per TB in the most recent quarter rose 18% to 19% year-over-year, with most of the 2027 output already covered by long-term agreements and some orders extending into 2028 and 2029.
The risk lies in high market expectations. In August, WDC reported earnings and guidance that both exceeded expectations, yet its stock price still fell significantly, indicating that steady growth may not suffice to drive valuations higher.
Going forward, key focus areas include the price per TB, 40TB ePMR shipments, and HAMR qualification. Supply of 40TB ePMR is ramping up, while the first-generation HAMR products are undergoing qualification with four major cloud customers, with shipments planned for the first half of 2027.
If prices and shipment volumes continue to grow, there remains room for WDC's earnings to rise; however, if demand slows or HAMR mass production is delayed, the stock price could come under pressure.
WDC Technical Analysis: $488 Becomes Key Resistance Level for Rebound
[Source: TradingView]
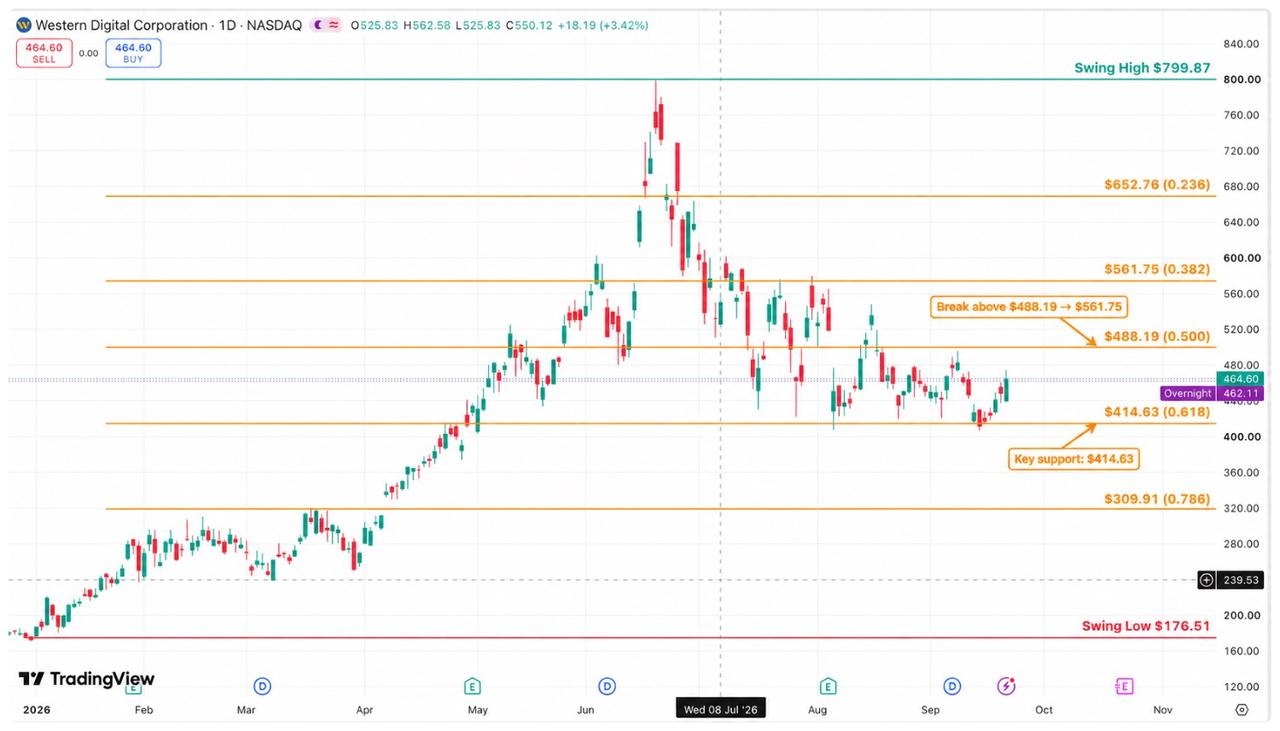
On the daily chart, WDC has been pulling back since touching $799.87 in June. It recently found support near $414.63 and rebounded to $464.60. The stock price is currently trading below the 0.5 Fibonacci retracement level of $488.19, remaining in a range-bound consolidation between $414 and $488 overall.
To the upside, $488.19 is a key short-term resistance level. If the stock breaks out on heavy volume and holds firm above this level, the next target could be $520, followed by the 0.382 Fibonacci retracement level at $561.75. The $561–$562 area is also close to a previous high-volume cluster, where selling pressure is expected to rise further.
To the downside, around $440 offers short-term support, while $414.63 serves as an important medium-term defensive level. If the stock retraces but holds $414.63, the range-bound structure remains intact; if it decisively breaks below on a closing basis, the correction could extend to $380, with further downside support near $309.91.
Overall, WDC is currently experiencing a range-bound rebound after a steep decline, and a medium-term trend reversal has not yet been confirmed. Holding firm above $488.19 could pave the way for a further recovery toward $520–$562, while a drop below $414.63 would signify a downward breakdown from the consolidation range.
Recommended Articles


