


What S&P 500 Gains of 9.5% in the First Half Signal for the Rest of the Year
Key Points
The S&P 500 index gained roughly 9.5% in the first half of 2026, which is a very good return for a six-month period.
Investors should be cautious about reading too much into the stock market's gyrations.
- 10 stocks we like better than SPDR S&P 500 ETF Trust ›
On average, investors generally expect the market to provide roughly a 10% return each year. In fact, if you look at the long-term history of the S&P 500 index (SNPINDEX: ^GSPC), that's about what you get, assuming you reinvest dividends. So what should an investor make of the fact that the first six months of 2026 saw the S&P 500 index advance 9.5% on a price-only basis and nearly 10.2% with dividends reinvested?
What's in the market average?
The first issue to address regarding market returns is that it includes bull and bear markets. A bull market is when the market goes up 20%, while a bear market is when it falls 20%. Bull and bear markets represent moves much larger than 10% and highlight that the market does not just go up at a steady, comfortable pace. The markets can be, and often are, quite volatile.
Missed AI’s "Act 1"? Act 2 Could Be 15x Bigger. Most investors think they missed the AI boat because they didn't buy Nvidia in 2005. But according to our analysts, we’re only at the end of "Act 1"—the R&D phase. "Act 2" is the global rollout. Continue »

Image source: Getty Images.
To be fair, if you bought and held the S&P 500 index over the long term, you would have seen the value of your portfolio rise dramatically. You can easily buy the index with a low-cost exchange-trade fund like Vanguard S&P 500 ETF (NYSEMKT: VOO). But you have had to hold on through some pretty trying periods. For example, since the turn of the century, SPDR S&P 500 ETF (NYSEMKT: SPY), the oldest ETF tracking this index, is up roughly 400% on a price-only basis, with reinvested dividends bringing the total return up to just over 700%.
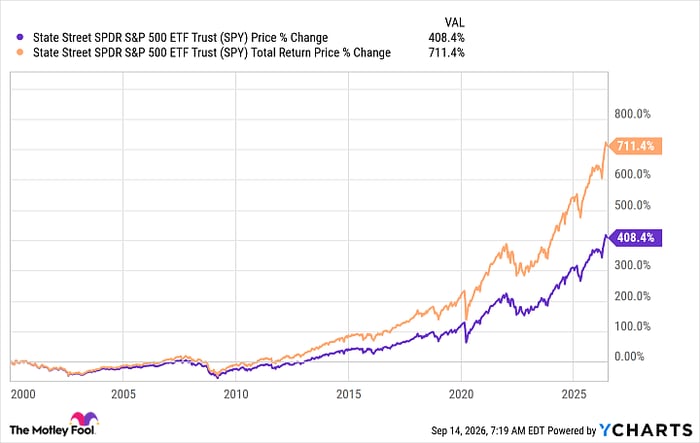
SPY data by YCharts
But that period of time included the dot-com crash, the Great Recession, and the global COVID pandemic. Each one was highlighted by a bear market, and those bear markets didn't start on Jan. 1 of any given year or end on Dec. 31. And the subsequent bull markets didn't start on a specific calendar date, either. In other words, the stock market can move dramatically in either direction at any point during the year.
What does the first half of 2026 tell you?
Essentially, six months of market returns tell you nothing about what the future holds. This is the same reason why investment companies have to warn you that past performance is not indicative of future returns. That said, the S&P 500's long history provides some guidance: buying and holding (and reinvesting dividends) is a powerful long-term investment strategy. But it is one that will require you to stick it out through both the good and bad times, whenever they may arrive.
Should you buy stock in SPDR S&P 500 ETF Trust right now?
Before you buy stock in SPDR S&P 500 ETF Trust, consider this:
The Motley Fool Stock Advisor analyst team just identified what they believe are the 10 best stocks for investors to buy now… and SPDR S&P 500 ETF Trust wasn’t one of them. The 10 stocks that made the cut could produce monster returns in the coming years.
Consider when Netflix made this list on December 17, 2004... if you invested $1,000 at the time of our recommendation, you’d have $387,158!* Or when Nvidia made this list on April 15, 2005... if you invested $1,000 at the time of our recommendation, you’d have $1,365,749!*
Now, it’s worth noting Stock Advisor’s total average return is 932% — a market-crushing outperformance compared to 211% for the S&P 500. Don't miss the latest top 10 list, available with Stock Advisor, and join an investing community built by individual investors for individual investors.
See the 10 stocks »
*Stock Advisor returns as of September 19, 2026.
Reuben Gregg Brewer has no position in any of the stocks mentioned. The Motley Fool has positions in and recommends Vanguard S&P 500 ETF. The Motley Fool has a disclosure policy.
Recommended Articles


