


If There's Just 1 Move All Investors Should Make Right Now, History Says It's This
Key Points
If the market keeps up its performance, this will be its fourth year in a row with double-digit gains.
That last happened ahead of the dot-com crash in 2000, and the market didn't reach a new high until 2007.
A defensive portfolio includes large, established AI stocks as well as value and dividend stocks.
- 10 stocks we like better than S&P 500 Index ›
With just over three months left in the year, the S&P 500 (SNPINDEX: ^GSPC) is up 11% year to date. If it manages to stay there, it will end 2026 with four consecutive years of double-digit gains, a feat not accomplished since 1999 -- incidentally, right before it crashed and lost nearly 50% of its value. It lost that over three years, and it didn't reach a new high until mid-2007. Many companies went out of business then as the dot-com bubble burst.
If history is any indication of what's about to happen, every investor should be doing this one thing right now.
Missed Nvidia in 2009? This Rare Signal Is Flashing Again. In 2009, a "Double Down" signal flashed for a little-known chipmaker called Nvidia. For the first time in years, that same "Total Conviction" signal is flashing for a company 1/100th the size of Nvidia. Continue »

Image source: Getty Images.
Is there an AI bubble?
The artificial intelligence (AI) revolution is real, but the hype might not exactly align with reality. Some well-established AI powerhouses, like Nvidia and Alphabet, don't look expensive at today's prices. They trade at 14 and 23 times forward, one-year earnings, respectively. However, other, smaller stocks look riskier as their valuations soar.
Bloom Energy, for example, trades at 53 times forward, one-year earnings, and only recently became profitable, while Marvell Technology trades at 33 times earnings. CoreWeave isn't yet profitable. It appears that investors are willing to take a chance on these stocks for the massive expected payoff as they grow.
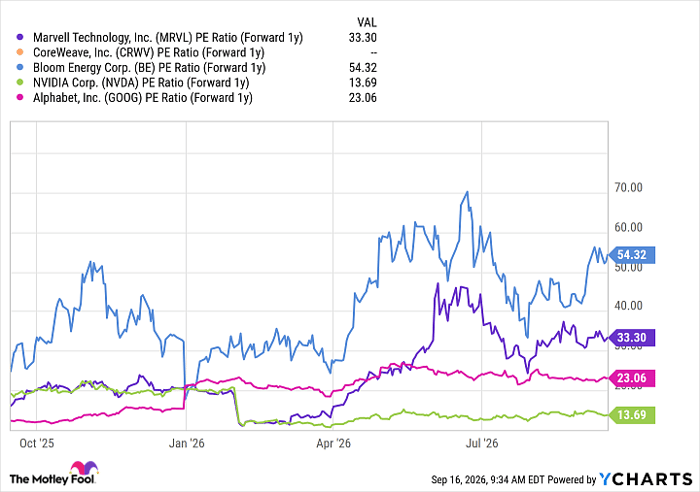
MRVL PE Ratio (Forward 1y) data by YCharts
These companies may indeed continue to expand and reward shareholders. However, there's a chance that the market could crash in the near future, and not all of the unprofitable upstarts will make it.
The defensive portfolio
There are other similarities between today's market and 1999. The CAPE, or cyclically adjusted P/E ratio, reached an all-time high at the end of 1999, right before the market crashed, and today it has reached its second-highest levels ever. That indicates a highly valued market.
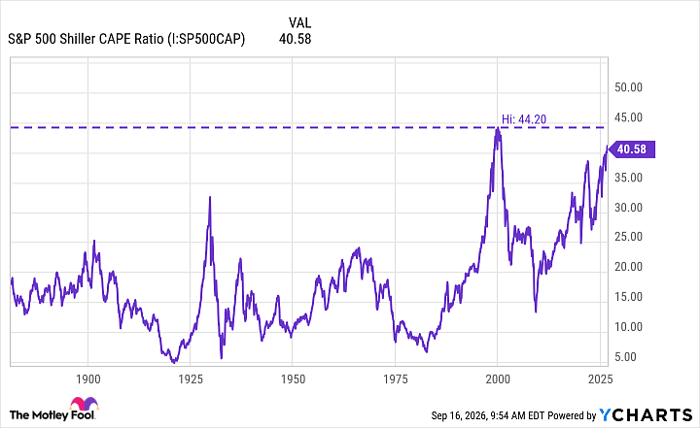
S&P 500 Shiller CAPE Ratio data by YCharts
Bond prices are falling as governments and companies spend freely, sending Treasury rates higher, while inflation continues to rage and interest rates remain high. These are all signs of economic instability.
That doesn't mean you should sell all of your AI stocks, or even all of your risky ones. The market could continue its bull streak, and AI could keep surging forward as an industry.
However, investors need to be prepared for the possibility and eventuality of a market crash by creating a defensive portfolio. That means you shouldn't have all of your investments, or too many of them, in AI or other high-risk categories.
Fill your portfolio with some of the larger and more reliable AI stocks to give you exposure while reducing your risk, and counterbalance your AI stocks with high-quality value and dividend stocks. These holdings can protect your assets in the case of market volatility or a burst AI bubble. If you haven't done that yet, do so before it's too late.
Should you buy stock in S&P 500 Index right now?
Before you buy stock in S&P 500 Index, consider this:
The Motley Fool Stock Advisor analyst team just identified what they believe are the 10 best stocks for investors to buy now… and S&P 500 Index wasn’t one of them. The 10 stocks that made the cut could produce monster returns in the coming years.
Consider when Netflix made this list on December 17, 2004... if you invested $1,000 at the time of our recommendation, you’d have $387,158!* Or when Nvidia made this list on April 15, 2005... if you invested $1,000 at the time of our recommendation, you’d have $1,365,749!*
Now, it’s worth noting Stock Advisor’s total average return is 932% — a market-crushing outperformance compared to 211% for the S&P 500. Don't miss the latest top 10 list, available with Stock Advisor, and join an investing community built by individual investors for individual investors.
See the 10 stocks »
*Stock Advisor returns as of September 19, 2026.
Jennifer Saibil has no position in any of the stocks mentioned. The Motley Fool has positions in and recommends Alphabet, Bloom Energy, Marvell Technology, and Nvidia. The Motley Fool has a disclosure policy.
Recommended Articles


