


Micron Stock Forecast: Citi Sees Explosive Growth in HBM, Server DDR5, and eSSD Demand From 2027; Will the Stock Break Out?
TradingKey - On September 17 ET, the day after the Federal Reserve announced a rate hike, Micron (MU) surged over 5%, with its stock price returning to $980.
Sanjay Mehrotra, CEO of Micron Technology, stated that the company's semiconductor packaging and testing facility in Sanand, Gujarat, India, has commenced commercial production to meet the growing demand for memory chips driven by artificial intelligence (AI).
The Sanand facility processes advanced DRAM and NAND wafers from Micron Technology's global manufacturing network into finished memory and storage products. In a statement, Micron Technology said the facility is expected to package and test tens of millions of chips in 2026, with capacity ramping up to hundreds of millions of chips in 2027.
Citi noted in its latest research report that as AI transitions from mere training and inference stages into an era of "continual learning," demand for HBM, server DDR5, and enterprise solid-state drives (eSSDs) will experience synchronized explosive growth starting in 2027.
While demand escalates rapidly, the supply side is constrained by HBM capacity allocation and a slowdown in technology migration, with capacity expansion lagging far behind demand. Citi accordingly projects that global memory capital expenditure in 2027 will jump 46.5% year-over-year to $80.4 billion; however, due to long lead times for capacity construction, even large-scale investments will struggle to fill the supply-demand gap.
Meanwhile, Citi forecasts that global memory capital expenditure (DRAM + NAND) will surge 46.5% year-over-year to $80.4 billion in 2027, accelerating significantly from $54.9 billion in 2026. DRAM capex is projected to grow 51.6% year-over-year to $58.6 billion, led by Samsung Electronics ($20.6 billion), SK Hynix ($17.5 billion), and Micron ($15.8 billion). However, Citi emphasized that a substantial portion of incremental DRAM investment will still flow toward HBM capacity and advanced DRAM process nodes, offering limited actual relief for conventional DRAM supply.
Citi pointed out that despite the massive surge in capex, higher spending levels will be insufficient to close the 2027 supply-demand gap given the long lead times required for greenfield capacity expansion. On this basis, Citi's outlook for the global memory supply-demand imbalance extends to 2031, arguing that continual learning and the large-scale adoption of personal AI and physical AI will serve as core drivers of this ultra-long-term structural supply shortage.
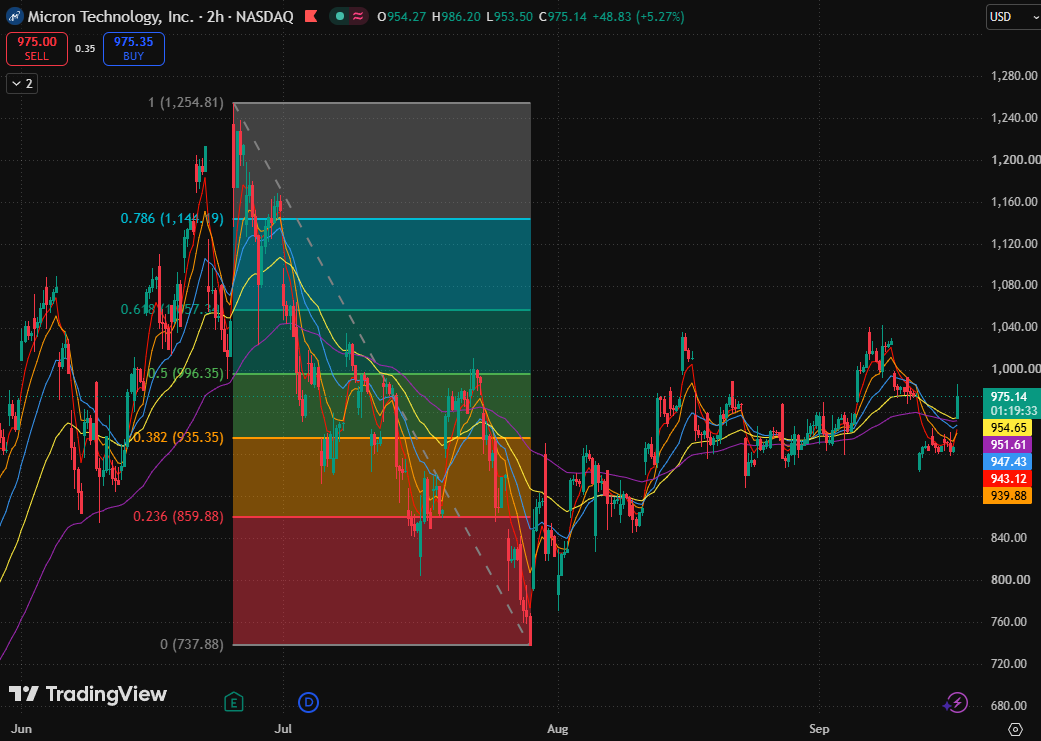
Micron two-hour candlestick chart, Source: TradingView
After finding a bottom near a periodic low ($737.88), Micron's stock price experienced a volatile recovery, briefly testing near $1,040 in early September before pulling back to a dense moving average cluster between $940 and $955. The latest price broke above the short-, medium-, and long-term moving averages: the 5-day MA ($944.38), 10-day MA ($940.57), 20-day MA ($947.79), 80-day MA ($954.83), and 160-day MA ($951.71).
The current price also sits above the 0.382 Fibonacci retracement level ($935.35) but remains below the 0.5 Fibonacci retracement level ($996.35). In the short term, this represents a strong technical bounce following a sharp decline, and reopening upside potential above $1,057.35 has yet to be confirmed.
Regarding moving averages, the five MAs are highly convergent between $940.57 and $954.83, forming a directional choice zone post-compression rather than a bullish divergence that has already opened up. Although the latest stock price has reclaimed all moving averages, the 5-day and 10-day MAs remain below the 80-day and 160-day MAs, indicating that short-term buying pressure has just recaptured the moving average cluster, and trend strength still requires confirmation at key levels.
Currently, the most crucial overhead confirmation level is the 0.5 Fibonacci retracement level ($996.35). After being broken to the upside in early September, this level was subsequently lost and has flipped from support to resistance. If subsequent 2-hour candlestick bars can close consecutively above $996.35 and hold it during pullbacks, the rebound will then have the conditions to target the 0.618 Fibonacci retracement level ($1,057.35) once again.
As for support, the confluence zone formed by the 80-day MA ($954.83) and the 0.382 Fibonacci retracement level ($935.35) is currently the key area to watch. As long as this area holds, the recent pullback is best characterized as an attempt to re-engage following strong consolidation; if $935.35 fails to hold, the probability of a short-term bounce failure rises.
Recommended Articles


