


If a Stock Market Crash Is Coming, History Says This Is the Smartest Move to Make
Key Points
The CAPE ratio and Buffett indicator point to stocks being very overvalued.
However, other metrics, such as the S&P 500's forward P/E ratio, show stocks trading at normal levels.
The key for investors is not to try to predict a crash and to keep dollar-cost averaging into core holdings.
- These 10 stocks could mint the next wave of millionaires ›
A couple of well-known market metrics have been flashing warning signs that stocks may be very overvalued. Meanwhile, an ongoing conflict with Iran, an already pressured consumer, and the potential for higher interest rates all could add kindling to a potentially explosive situation.
One of the most alarming metrics that the market may be overvalued is that the S&P 500's (SNPINDEX: ^GSPC) cyclically adjusted price-to-earnings (CAPE) ratio has closed above 40 for three straight months. This metric was developed by economist Robert Shiller to smooth out earnings cyclicality and is based on a 10-year average of inflation-adjusted earnings. The last time the CAPE ratio sat above 40 for an extended period was right before the dot-com bubble crashed. A 40 reading is more than double the metric's historical average of roughly 17 and approximately 50% higher than 20-year historical average.
Missed Nvidia in 2009? This Rare Signal Is Flashing Again. In 2009, a "Double Down" signal flashed for a little-known chipmaker called Nvidia. For the first time in years, that same "Total Conviction" signal is flashing for a company 1/100th the size of Nvidia. Continue »
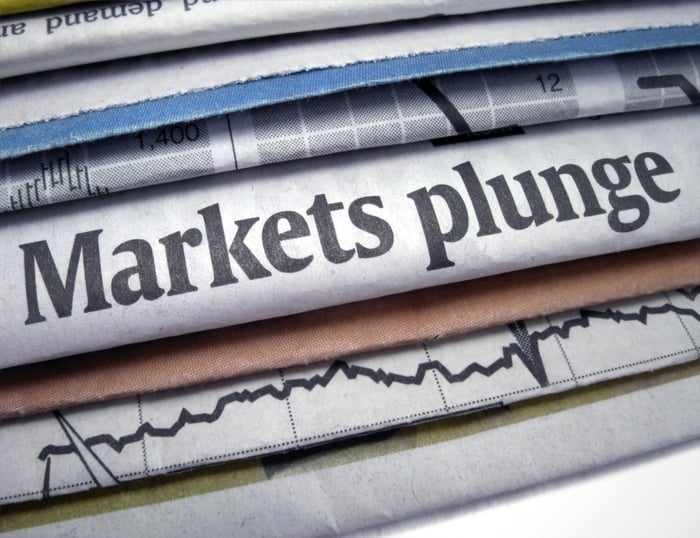
Image source: Getty Images
At the same time, one of legendary investor Warren Buffett's favorite market valuation metrics is also signaling that stocks are extremely overvalued. Nicknamed the Buffett indicator, this metric adds up the total value of the U.S. stock market and divides it by the gross domestic product (GDP). This market gauge is currently sitting at around 240%, which is double the 120% where Buffett considers stocks overvalued.
Is a market crash coming?
Now, just because these two metrics indicate the market is extremely overvalued, that does not mean a market crash is imminent. First, the market makeup is much different from in the past. Technology accounts for more than a third of the S&P 500 components, and that percentage is probably understated, given that some companies, including Amazon and Tesla, get classified into other sectors. Today, the S&P 500 is dominated by top tech companies with durable businesses that generate a boatload of operating cash flow and tend to be much less cyclical than many other industries.
At the same time, the advent of artificial intelligence (AI) and the steepening of the technology curve are two factors that make this market different than any in the past. The large tech giants leading the AI infrastructure charge are seeing strong, quick paybacks on their AI investments, with Amazon noting that it breaks even within two to three years while locking in five-year deals and chips tending to have six-year lifespans. Meanwhile, AI is helping companies across industries reduce costs and become more efficient. The technology curve has also steepened, with new breakthroughs happening much more quickly than in the past.
Metrics like the CAPE, meanwhile, are backward-looking and, based on near-term future projections, top tech stocks generally look reasonably valued, if not downright cheap. According to FactSet, the 12-month forward P/E of the S&P 500 is 19.5, which is below its five-year average of 19.8 and just above its 10-year average of 19. So, based on this metric, the market does not look overvalued.
The smartest move to make now
Whether the market will crash anytime soon is really anyone's guess. There are certainly loud voices in both corners, but ultimately, no one can be certain.
As such, the smartest move an investor can make ahead of a potential crash is to continue to dollar-cost average into a broad-based index exchange-traded fund (ETF) such as the Vanguard S&P 500 ETF (NYSEMKT: VOO), which tracks the S&P 500. Dollar-cost averaging is smart because it completely removes emotion and market timing. If you're trying to predict a market crash and are wrong, you could miss years of gains sitting on the sidelines. Meanwhile, if you do correctly predict a bear market, you then have to get back into the market at the right time. The stock market often has some of its biggest one-day gains after big pullbacks, and if you miss out on one of these big days, your performance will generally lag.
So don't let the fear of a market crash get in the way of investing; just be smart about it. History shows that adding to a core portfolio holding, like the Vanguard S&P 500 ETF, in both bull and bear markets pays off over the long term, time and again.
Where to invest $1,000 right now
When our analyst team has a stock tip, it can pay to listen. After all, Stock Advisor’s total average return is 960%* — a market-crushing outperformance compared to 213% for the S&P 500.
They just revealed what they believe are the 10 best stocks for investors to buy right now, available when you join Stock Advisor.
See the stocks »
*Stock Advisor returns as of September 9, 2026.
Geoffrey Seiler has positions in Amazon and Vanguard S&P 500 ETF. The Motley Fool has positions in and recommends Amazon, FactSet Research Systems, Tesla, and Vanguard S&P 500 ETF. The Motley Fool has a disclosure policy.
Recommended Articles


