

SpaceX Stock Price Prediction: Fails Again to Challenge $150, Can the Stock Still Rise?

Source Tradingkey

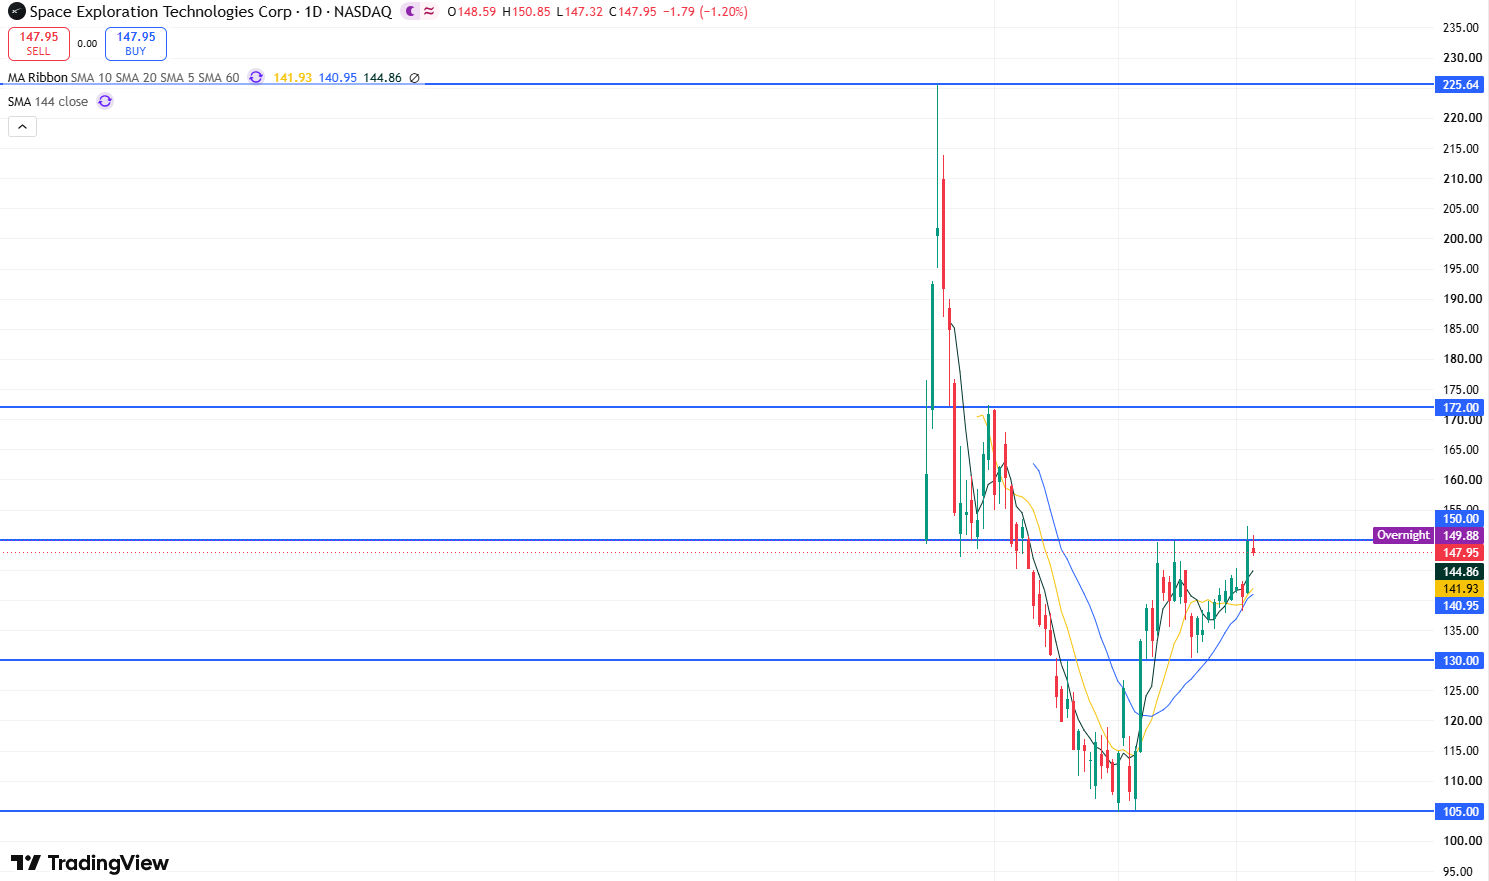
TradingKey - SpaceX (SPCX) has shown a clear rebound in stock performance recently. On September 3, SPCX surged 6.42% on heavy volume to $149.74, hitting an intraday high of $152.30; on September 4, it pulled back slightly by 1.20% to close at $147.95. Notably, while the three major US stock indexes all fell last Friday, SPCX saw only a minor pullback, still largely holding its breakout level following the previous session's sharp gains.
SPCX-33dca91d6ada49e897e5491a19dbe01e

SPCX daily stock price chart, Source: TradingView

Looking at the daily chart of SPCX's stock price, the stock formed a short-term bottom above $105 in early August, after which its lows continuously shifted higher. The sharp rise on September 3 pushed it to a new two-month high, with trading volume reaching approximately 121 million shares on that day, noticeably higher than the recent average, indicating that the breakout was backed by capital inflows.

Meanwhile, the moving average structure has also begun to strengthen. As of September 4, the 5-day, 10-day, and 20-day moving averages were $144.86, $141.93, and $140.95, respectively, with the stock price climbing above all these short-to-medium-term moving averages. The latest 14-day RSI is at 58.47, entering a relatively strong zone without being clearly overbought, while MACD momentum also remains positive.

Currently, the stock rose sharply last Thursday, briefly breaking above $150 intraday. Although the closing price failed to hold firm above $150, the moving higher of the candlestick highs indicates that market sentiment leans bullish. PCX has recently encountered selling pressure twice above $150; if it can hold above $155 on heavy volume, it would signal a further escalation of the rally since August, with the next target at $160–$165.

On the downside, the primary support to watch below is the $145–$140 range. If the stock price stays above $140, the short-term uptrend structure remains intact; if it breaks below $140, it may pull back further toward the $130 support level.

Disclaimer: For information purposes only. Past performance is not indicative of future results.
placeholder
Will the Tech Rally Continue? The Technical Verdict on the NASDAQ 100 Riding a massive 32% post-earnings wave, the Nasdaq-100 is showing its first signs of exhaustion. We break down crucial exit and entry rules for long positions this week.
Author  Mitrade Team
Jun 05, Fri
Riding a massive 32% post-earnings wave, the Nasdaq-100 is showing its first signs of exhaustion. We break down crucial exit and entry rules for long positions this week.
placeholder
XRP Price Prediction for July 2026: Can Buyers Finally Break the Downtrend?XRP (XRP) price trades near $1.05, caught between a year-long downtrend and a sudden burst of buying.July has historically rewarded XRP holders. This year the month arrives with on-chain accumulation
Author  Beincrypto
Jun 30, Tue
XRP (XRP) price trades near $1.05, caught between a year-long downtrend and a sudden burst of buying.July has historically rewarded XRP holders. This year the month arrives with on-chain accumulation
placeholder
XAUUSD Gold Analysis: Gold Holds Above $4,350 Ahead of US Inflation Data Is $4,500 Next? Gold holds above $4,350 following weak US jobs data. As inflation reports approach and UBS eyes $5,000, can XAUUSD break resistance at $4,435 to rally toward $4,500?
Author  Naoufal Seddik
Aug 12, Wed
Gold holds above $4,350 following weak US jobs data. As inflation reports approach and UBS eyes $5,000, can XAUUSD break resistance at $4,435 to rally toward $4,500?
placeholder
Gold Price Analysis Today: Gold Drops 1.32% Despite Lower Fed Rate-Hike Bets, Can $4,313 Support Hold? Gold fell 1.32% on August 13 after rising to $4,449.73, then reversing lower and closing near $4,349.918 below the $4,356.46 support. Softer US inflation data reduced Fed rate hike expectations, but selling pressure still dominated the session. Will $4,313 support hold?
Author  Naoufal Seddik
Aug 14, Fri
Gold fell 1.32% on August 13 after rising to $4,449.73, then reversing lower and closing near $4,349.918 below the $4,356.46 support. Softer US inflation data reduced Fed rate hike expectations, but selling pressure still dominated the session. Will $4,313 support hold?
placeholder
Gold Price Analysis Today: Gold Gains 0.94% as Markets Expect Fed to Hold Rates, Can $4,449 Resistance Break? Gold gained 0.94% on August 17, closing near $4,417.30 as softer US data strengthened expectations for unchanged Fed rates in September. Gold remains bullish, with $4,449.730 resistance and $4,310.650 support in focus.
Author  Naoufal Seddik
Aug 18, Tue
Gold gained 0.94% on August 17, closing near $4,417.30 as softer US data strengthened expectations for unchanged Fed rates in September. Gold remains bullish, with $4,449.730 resistance and $4,310.650 support in focus.
goTop
quote