


Are Stocks Going to Plunge if Congress Is Split Under President Donald Trump? Here's What History Says About Stock Market Returns in This Scenario.
Key Points
Outsize annualized returns for the Dow Jones Industrial Average, S&P 500, and Nasdaq Composite have been the norm under President Trump.
Prediction markets strongly favor Democrats retaking one or both houses of Congress on Election Night (Nov. 3).
Although midterm elections can create fiscal policy uncertainty, corporate earnings growth ultimately does the talking on Wall Street.
- 10 stocks we like better than S&P 500 Index ›
Since the late 1890s, roughly three-quarters of all presidential terms have ended with the stock market delivering gains. But under President Donald Trump, the annualized returns of the Dow Jones Industrial Average (DJINDICES:^DJI), S&P 500 (SNPINDEX:^GSPC), and Nasdaq Composite (NASDAQINDEX:^IXIC) have been higher than under most other presidents.
While a significant chunk of these gains traces to the evolution of artificial intelligence and has little to do with the goings-on in Washington, D.C., fiscal policy changes implemented on Capitol Hill can impact business growth rates and the stock market. This places the spotlight squarely on the Nov. 3 midterm elections.
Missed Nvidia in 2009? This Rare Signal Is Flashing Again. In 2009, a "Double Down" signal flashed for a little-known chipmaker called Nvidia. For the first time in years, that same "Total Conviction" signal is flashing for a company 1/100th the size of Nvidia. Continue »
For the first two years of President Trump's non-consecutive second term, he'll have enjoyed a unified government, with Republicans controlling a majority of seats in both houses of Congress. But this ideal scenario for the president may be about to change.

President Trump's unified government is at risk of disruption on Nov. 3. Image source: Official White House Photo.
In the 20 midterm elections since the end of World War II, the party that holds the White House has lost seats in the House of Representatives 18 times. Similar losses were noted in the Senate, albeit not to the same degree as the House.
Could a stock market plunge await if Donald Trump's unified government is disrupted by Election Night losses? Nearly a century of historical return data provides a pretty clear answer.
Prediction markets are forecasting a divided Congress under President Trump
As of this writing at the beginning of September, Republicans hold a majority of seats (53 of 100) in the U.S. Senate and a very slim majority in the House (218 of 435 seats). According to prediction markets, neither majority is considered safe for Trump's party come Nov. 3.
In the early morning hours on Sept. 1, Polymarket traders forecast a 51% chance of a Democratic sweep on Election Night, with another 36% projecting that Democrats will take control of the House while Republicans retain the Senate. Only one-eighth of bettors on Polymarket's platform believe Republicans will maintain their unified government.
BREAKING: Markets now expect the Democrats to sweep both the House and Senate in the 2026 midterm elections.
— The Kobeissi Letter (@KobeissiLetter) September 1, 2026
Less than one year ago, Democrats had just a 20% chance of sweeping the midterms.
Election day is 63 days away. pic.twitter.com/MKXR0EkB0u
Sitting presidents prefer a unified government because it's often easier to pass major legislation. During the first year of Trump's first term, he and Congress passed the Tax Cuts and Jobs Act (TCJA), which permanently lowered the peak marginal corporate income tax rate from 35% to 21% and reduced the personal income tax brackets for a majority of working Americans. The TCJA has been instrumental in fueling record share buybacks.
A unified government also aided Trump in passing his second major piece of tax and spending legislation in the first year of his second term. The "Big, Beautiful Bill" made the TCJA's personal tax bracket reductions permanent, as well as introduced a bevy of temporary tax breaks from calendar years 2025 through 2028.
If Democrats were to retake one or both houses of Congress, it would make it virtually impossible for President Trump to pass major tax and spending legislation. Furthermore, it would almost certainly make debt-ceiling negotiations more challenging, potentially leading to federal government shutdowns.
But the million-dollar question for investors is: What happens to stocks when a Republican president oversees a split Congress?
Don't shoot the messenger here, but the party in the White House has lost seats in 20 of the past 23 midterms. pic.twitter.com/KyUAAlNlJs
— Ryan Detrick, CMT (@RyanDetrick) January 21, 2026
According to Mike Patton, the president of Integrity Wealth Management and a Forbes columnist, a split Congress works out nicely for investors. Between 1946 and 2020, the average annual return for the timeless Dow Jones Industrial Average when the leadership of Congress was split between Democrats and Republicans was a hearty 12.9%!
However, Retirement Researcher took things one step further by examining these returns based on the party affiliation of the sitting president. Interestingly, the 13 years between 1926 and 2023 in which Republicans held a unified government yielded an average annual return of 14.52% for the benchmark S&P 500.
In comparison, the 34 years that featured a Republican president and a divided government (meaning one or both houses of Congress controlled by Democrats) yielded an average annual return of just 7.33% for the S&P 500. While there's no indication that stocks will plunge if Election Night produces a split Congress, nearly a century of history shows that more modest stock returns should be expected in its wake.

Image source: Getty Images.
Stocks thrive, regardless of the party in power
At any given time, several catalysts threaten to upend the stock market, such as rapidly rising outstanding margin debt and premium valuations. From time to time, these headwinds can lead to stock market corrections and even a short-lived plunge. The makeup of Congress is rarely, if ever, responsible for these elevator-down moves.
While historical data shows that certain congressional makeups are more favorable than others, the average annual return of the Dow Jones Industrial Average or S&P 500 is decisively positive, no matter how the puzzle pieces are arranged. Regardless of whether Republicans retain a unified government, Democrats sweep both houses of Congress, or Democrats and Republicans split Congress, history says stocks can head higher.
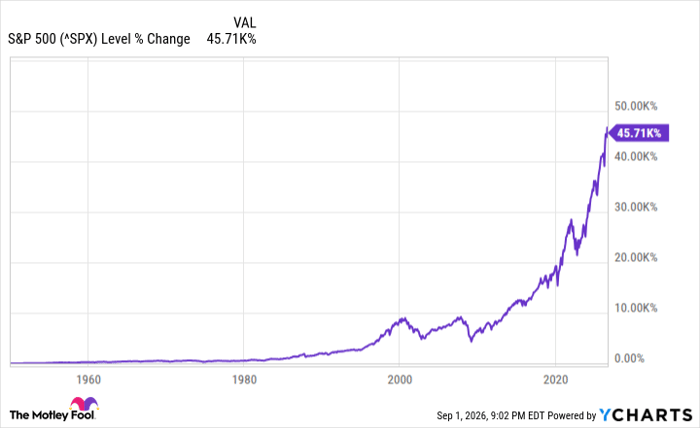
Data from analysts at Crestmont Research demonstrates the importance of looking beyond the noise, including midterm elections, and remaining invested over long periods.
^SPX data by YCharts
Every year, Crestmont updates a data set that examines the annualized rolling 20-year total returns, including dividends, of the benchmark S&P 500 since 1900. Even though the S&P wasn't officially introduced until 1923, researchers were able to track the total return of its components in other major indexes back to the start of the 20th century.
Crestmont Research's data set yielded 107 rolling 20-year periods, each producing a positive annualized total return. Put another way, if an investor had, hypothetically, purchased an S&P 500 index fund between 1900 and 2006 and held that position for 20 years, they would have made money 100% of the time.
Over 20-year periods, it hasn't mattered which political party held the White House or controlled Congress. In the end, corporate earnings growth does the talking.
Should you buy stock in S&P 500 Index right now?
Before you buy stock in S&P 500 Index, consider this:
The Motley Fool Stock Advisor analyst team just identified what they believe are the 10 best stocks for investors to buy now… and S&P 500 Index wasn’t one of them. The 10 stocks that made the cut could produce monster returns in the coming years.
Consider when Netflix made this list on December 17, 2004... if you invested $1,000 at the time of our recommendation, you’d have $421,997!* Or when Nvidia made this list on April 15, 2005... if you invested $1,000 at the time of our recommendation, you’d have $1,413,876!*
Now, it’s worth noting Stock Advisor’s total average return is 978% — a market-crushing outperformance compared to 213% for the S&P 500. Don't miss the latest top 10 list, available with Stock Advisor, and join an investing community built by individual investors for individual investors.
See the 10 stocks »
*Stock Advisor returns as of September 5, 2026.
Sean Williams has no position in any of the stocks mentioned. The Motley Fool has no position in any of the stocks mentioned. The Motley Fool has a disclosure policy.
Recommended Articles


