


Goldman Sachs Stock Rebounds Toward $1,045 as Deal Momentum Supports GS
TradingKey - Goldman Sachs opened today at $1,038, up approximately 3.34% at yesterday’s closing price of $1,037.93. The stock has rebounded from the $999 region and is entering the downtrend of the large symmetrical triangle. From an investing standpoint, Q2 delivered the most strength in a single trading and dealmaking quarter as well as many recent acquisitions in the asset management sector and a potentially game changing bank-sponsored stablecoin within the growth story. The real question is can Goldman Sachs clear $1,040-$1,045 and continue toward $1,057-$1,096.
Q2 Revenue and Profitability Were Exceptionally Strong
Goldman reported Q2 net revenue of $20.34 billion, up 39% from the prior corresponding period, and net earnings of $6.63 billion. Diluted EPS were $20.98 and annualized return on common equity was 23.5%.
The quarter was not a one-off strong result from a major trading event. Global Banking & Markets revenue was $15.52 billion, up 53%, from strong activity in all segments of the business, Equities, FICC and IB.
Trading Remains a Major Earnings Engine
Equities revenue of $7.42 billion was up 72%. Results were driven by strong derivatives, cash equities and prime financing. FICC revenue of $4.59 billion was up 32% with greater activity in rates, commodities, mortgages, and structured lending.
The nature of the business is a boon when markets are active and a danger if markets normalize. During times of client trading activity, Goldman's earnings are more exposed than their universal banking peers.
Investment Banking Fees Rose 55%
Revenue for investment banking services jumped 55% to $3.40 billion. Revenue from advisory services totaled $1.38 billion, equity underwriting brought in $985 million, and debt underwriting contributed $1.03 billion.
Goldman Sachs noted that the backlog for investment banking services increased from the previous quarter and from year end 2025. The calendar for Initial Public Offerings (IPOs) from the reopening continues at a strong pace and should contribute to services revenue in future quarters.
Asset Management Is Becoming More Important
Goldman Sachs is attempting to lessen the reliance on trading and advisory services by cyclically improving earnings. In August, the firm agreed to acquire NEOS Investments which manages around $30 billion invested in 19 options-based income ETFs. This hinge element will result in a $130 billion ETF ecosystem.
Goldman Sachs also agreed to acquire LCN Capital Partners, a real-estate investment manager, with around $3 billion in assets under supervision. This purchase also adds to Goldman’s Asset & Wealth Management division.
Stablecoin Plan Adds a New Strategic Angle
Earlier this year, Goldman Sachs became part of a group effort to launch a U.S. dollar backed stablecoin in early 2027. The group plans to add other G7 currencies to the stablecoin and have the Euro as a focus currency.
The direct earnings impact of the stablecoin is predicted to be minimal, but the strategic focus on cross border settlement, institutional payments, tokenized assets, and treasury management is expected to create value. The main risk to the strategic focus is regulation as many of the central banks still maintain a cautious position toward funding of stablecoins.
Macro Conditions Turned More Supportive
Rising stock prices in the financial sector indicate improved conditions for macroeconomic trends. This is following statements made by Fed Governor Waller that he may consider supporting a hold on interest rates if signs of disinflation are present. An expectation that the Fed will hike interest rates in September has traded down, pushing prices in the Treasury market and equities up.
While lower Treasury yields may create benefits in M&A, underwriting and leveraged finance, there is still trading volatility that is beneficial to Goldman. The upcoming employment and inflation reports are the major macro events of focus.
Goldman Sachs Technical Analysis: $1,045 Is the Breakout Trigger
GS closed at $1,037.93 right at the chart's $1,038.41. Buyers defended $999.34, taking price back to $1,026.63 and reclaiming the moving average. Price is now pushing into the triangle's descending resistance around $1,040-$1,045.
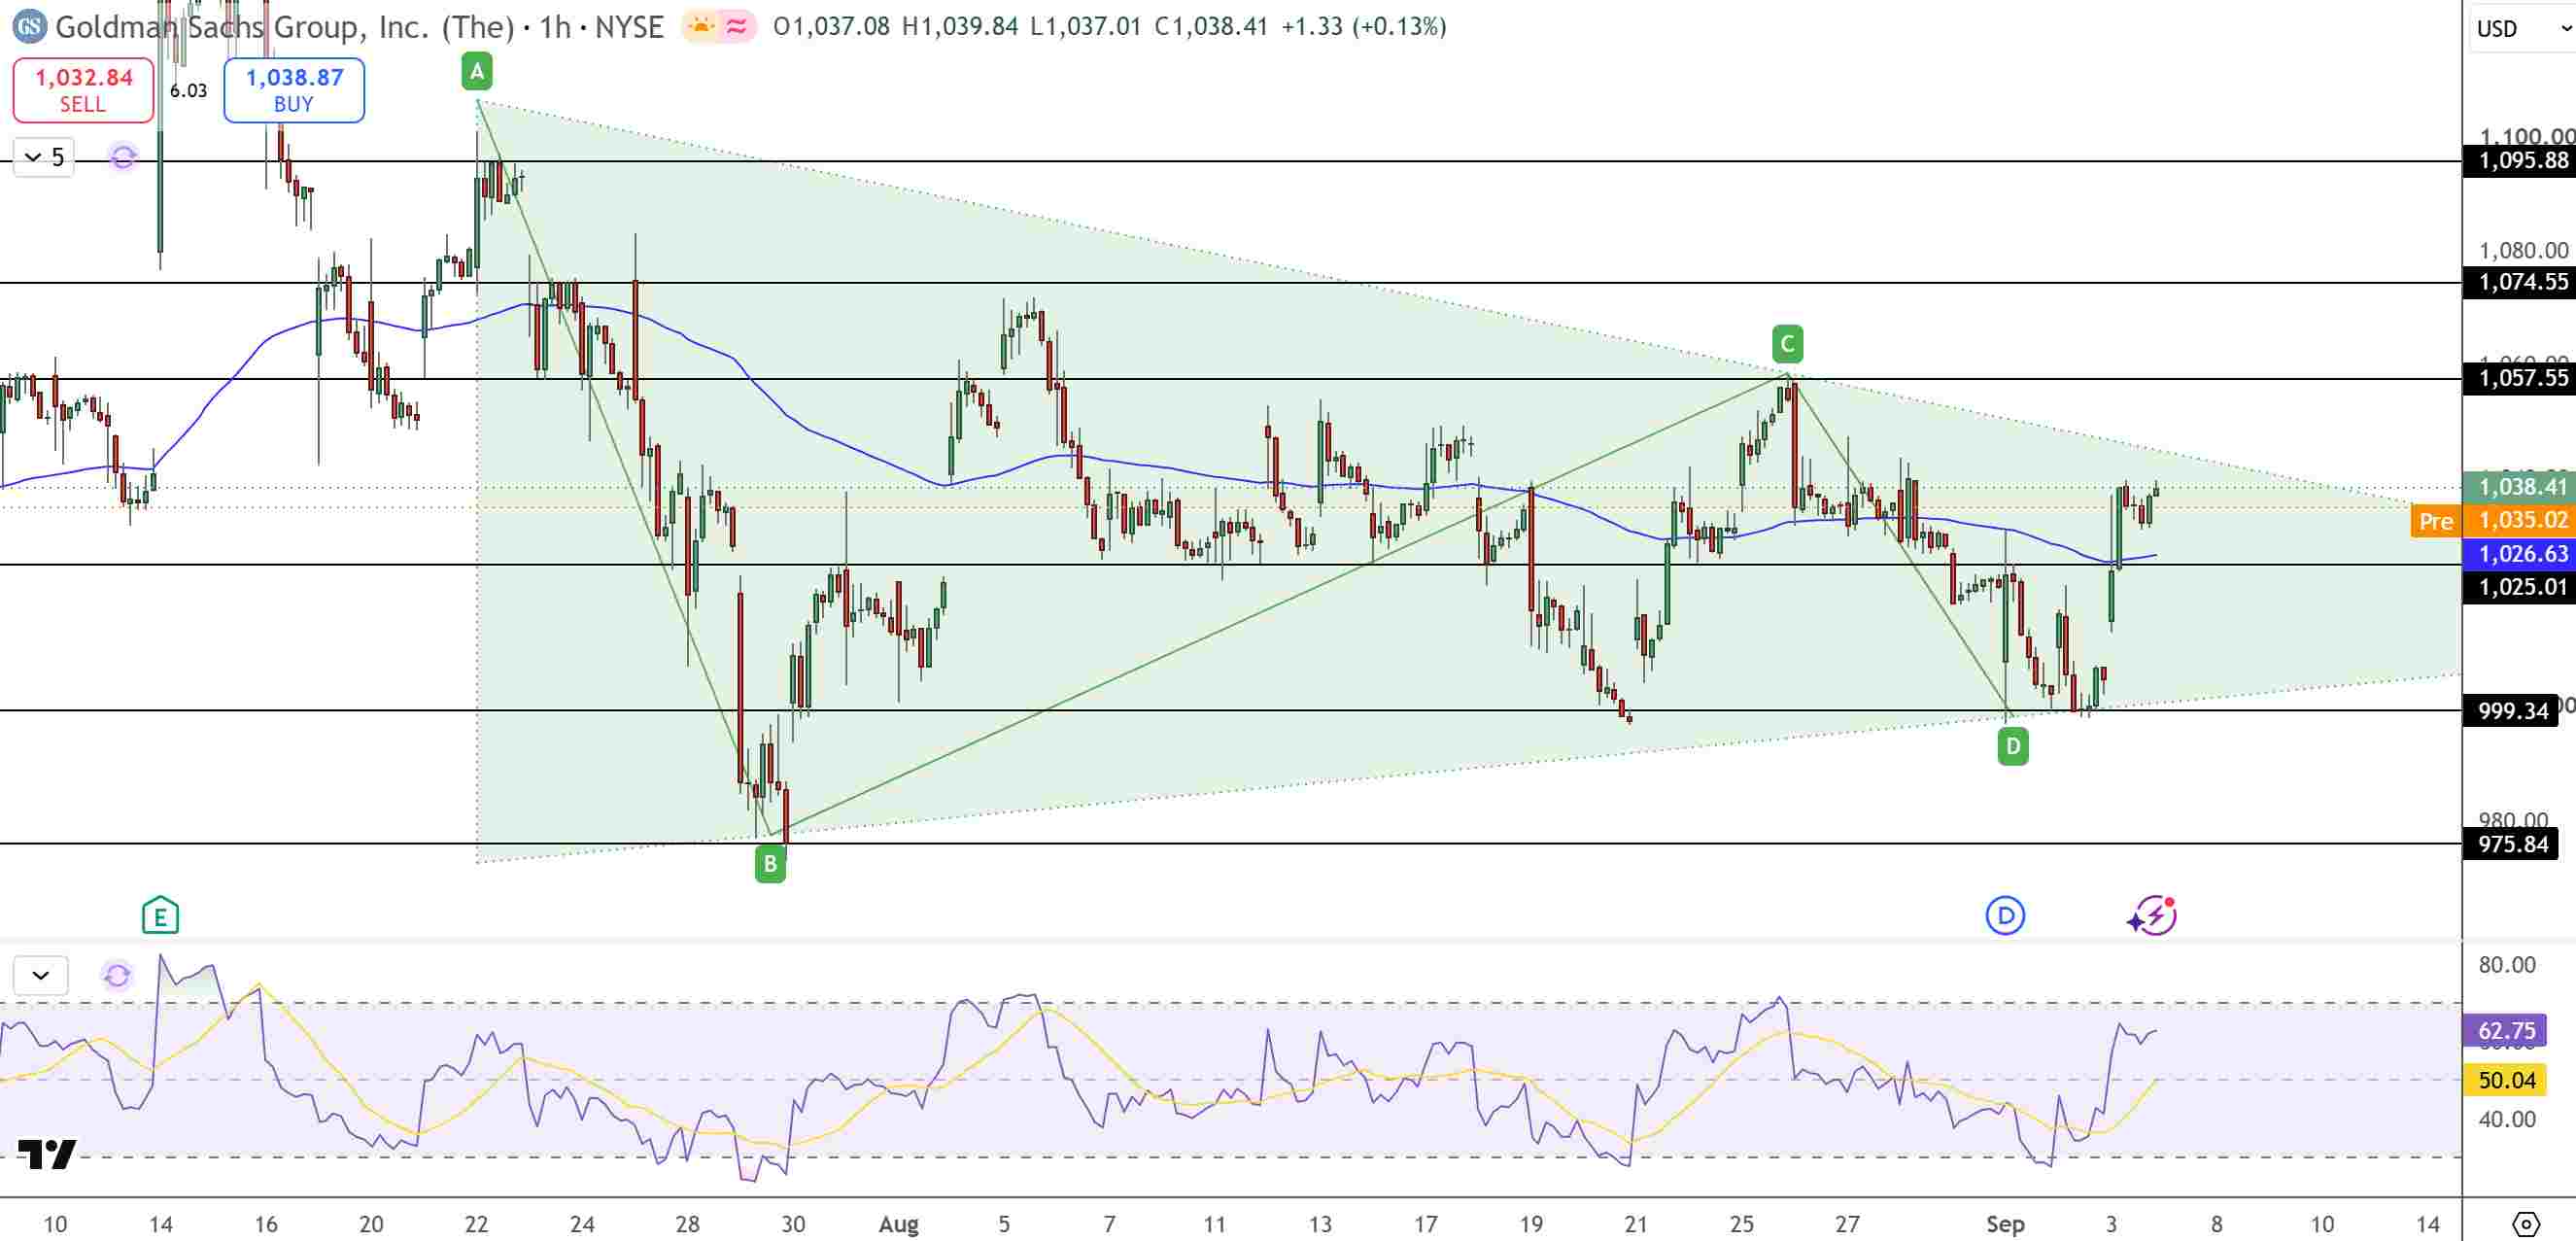
Goldman Sachs Price Chart - Source: Tradingview
A sustained hourly break above that resistance line would be bullish and also exposure $1,057.55. Above that, the next resistance levels are $1,074.55 and $1,095.88.
RSI at 63 is rising with buying pressure above its signal line of 50. The trendline was not broken. On the downside, $1,025.01-$1,026.63 was the first support zone. Losing that support would focus again on $999.34, and a break of $999 would be bearish $975.84.
Key Levels
· Latest completed close: $1,037.93
· First support: $1,025.01-$1,026.63
· Major support: $999.34
· Breakout resistance: $1,040-$1,045
· First upside target: $1,057.55
· Higher targets: $1,074.55 and $1,095.88
· Downside target: $975.84
· RSI: Around 63, bullish but not overbought
Why is Goldman Sachs stock strengthening?
GS is quickly benefiting from some positive macroeconomic movement, better than expected results from trading and investment banking for the second quarter with a healthy deal pipeline and increasing recurring revenue from their asset management business.
What level confirms another GS breakout?
The main level to watch is sustained hours above the triangle resistance around $1,045, which could call in buyers and signal a move towards $1,057.55 and $1,074.55.
Bottom Line
Goldman’s fundamentals remain positive with record results from Q2, solid trading revenue and improved deal activity. The NEOS and LCN acquisition agreements add recurring fee revenue, and the stablecoin consortium adds possible revenue from longer term payments. Looking at the charts, GS remains constructive above $1,025, but $1,040-$1,045 is key resistance. A clear break above that would target $1,057-$1,096. Below $999 erases the bullish structure.
Recommended Articles


