


The Stock Market Just Did Something for the First Time Ever. History Says Investors Should Be Worried. But Could This Time Be Different?
Key Points
The S&P 500 recently reached an all-time high.
Stock market valuations are also at historically high levels.
However, S&P 500 earnings are soaring faster than share prices.
- 10 stocks we like better than S&P 500 Index ›
Long-time investors may think they've seen it all. However, they witnessed something just a couple of weeks ago that had never happened before in U.S. stock market history. The S&P 500 (SNPINDEX:^GSPC) topped 7,750 for the first time. The widely followed index even briefly flirted with reaching the 7,800 mark. Although the S&P 500 has retreated slightly since then, it's still only about 2% below its all-time high.
Achieving this milestone is exciting. However, it could also be scary for many investors. Soaring valuations have accompanied the stock market's surge. History shows that investors should be worried when valuations become as frothy as they are now. But five words could be true that usually aren't: This time could be different.
Missed Nvidia in 2009? This Rare Signal Is Flashing Again. In 2009, a "Double Down" signal flashed for a little-known chipmaker called Nvidia. For the first time in years, that same "Total Conviction" signal is flashing for a company 1/100th the size of Nvidia. Continue »

Image source: Getty Images.
A worrisome first for the S&P 500?
Investors have become accustomed to the S&P 500 setting record highs in recent years. The index has skyrocketed more than 130% since the beginning of 2020. The stock market's sizzling performance is a reason for celebration. However, it's also a reason for caution.
While the S&P 500 has risen sharply, so has the benchmark valuation metric for the index: the S&P 500 Shiller CAPE ratio. CAPE stands for cyclically adjusted price-to-earnings ratio. Nobel laureate and economist Robert Shiller created the metric to measure the S&P 500's valuation by smoothing earnings multiples using a 10-year moving average and adjusting earnings for inflation.
The S&P 500 Shiller CAPE ratio has been higher than it is now only once before -- in late 1999 and early 2000. Soon after reaching that high, the stock market tanked as the dot-com bubble burst. Some believe the market is in an AI bubble now.
Another issue is how rapidly the CAPE ratio has risen. The previous times the metric has spiked to reach a record high include 1929, 2000, and 2021. The first of those years should be familiar: It's when the massive stock market crash that ushered in the Great Depression occurred. We've already discussed the 2000 market plunge. The S&P 500 Shiller CAPE ratio's surge in 2021 preceded the 2022 bear market.
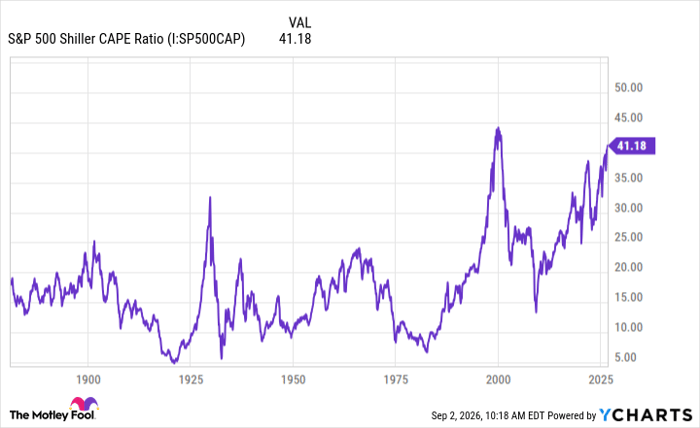
S&P 500 Shiller CAPE Ratio data by YCharts
Why this time could be different
Some might roll their eyes when they hear anyone say that this time could be different for the stock market. People said that during the dot-com boom -- and things didn't end well then. However, there is a pretty good case to be made that this time really is different.
The centerpiece of this argument is simple: Earnings are growing significantly faster than stock prices. FactSet reported that, as of Aug. 28, 2026, with 97% of S&P 500 companies having reported second-quarter 2026 results, 86% reported a positive earnings per share (EPS) surprise. Furthermore, 77% of S&P 500 companies reported a positive revenue surprise. Overall, the S&P 500's earnings grew by 52%.
Earnings are growing so robustly that the S&P 500's forward price-to-earnings ratio now stands at 19.6, which is below the five-year average of 19.9. This could (and arguably should) make the surging S&P 500 Shiller CAPE ratio less frightening.
Granted, the contribution of the so-called "Magnificent Seven" stocks has been a big factor behind the S&P 500's earnings growth. In particular, investment gains for Alphabet (NASDAQ:GOOG) (NASDAQ:GOOGL) and Amazon (NASDAQ:AMZN) turbocharged their Q2 earnings results. Still, though, even excluding the two companies' one-time investment gains, S&P 500 net profit margins were 15.1%, the highest on record.
The quandary for investors
Investors may find themselves in a quandary. A sky-high S&P 500 Shiller CAPE ratio has been a reliable predictor of market downturns in the past. Caution certainly seems warranted, given the valuation metric's track record. On the other hand, S&P 500 earnings are growing so briskly that there appears to be more room for stocks to run.
What should investors do? I like Warren Buffett's approach. Buffett and his successor, Greg Abel, continue to be highly selective in how they deploy Berkshire Hathaway's (NYSE:BRKA) (NYSE:BRKB) massive cash stockpile. But they are nonetheless finding some attractive stocks to buy, notably including Alphabet. I think that this strategy of watchful deliberation, combined with capitalizing on good opportunities, makes sense for all investors.
I'm not sure if this time truly is different than the past with respect to S&P 500 valuations. However, following Buffett's lead should enable investors to win over the long run either way.
Should you buy stock in S&P 500 Index right now?
Before you buy stock in S&P 500 Index, consider this:
The Motley Fool Stock Advisor analyst team just identified what they believe are the 10 best stocks for investors to buy now… and S&P 500 Index wasn’t one of them. The 10 stocks that made the cut could produce monster returns in the coming years.
Consider when Netflix made this list on December 17, 2004... if you invested $1,000 at the time of our recommendation, you’d have $445,833!* Or when Nvidia made this list on April 15, 2005... if you invested $1,000 at the time of our recommendation, you’d have $1,402,153!*
Now, it’s worth noting Stock Advisor’s total average return is 993% — a market-crushing outperformance compared to 214% for the S&P 500. Don't miss the latest top 10 list, available with Stock Advisor, and join an investing community built by individual investors for individual investors.
See the 10 stocks »
*Stock Advisor returns as of September 5, 2026.
Keith Speights has positions in Alphabet, Amazon, and Berkshire Hathaway. The Motley Fool has positions in and recommends Alphabet, Amazon, and Berkshire Hathaway. The Motley Fool has a disclosure policy.
Recommended Articles


