

SanDisk Stock Forecast: QLC Enterprise SSD Enters Volume Ramp Phase, Revenue Rises 103% QoQ, Stock Expected to Extend Rally

Source Tradingkey

TradingKey - On September 1 Eastern Time, SanDisk (SNDK) stock rose 5% yesterday after being added to the MSCI USA Index, before reversing earlier losses to gain over 2% today.

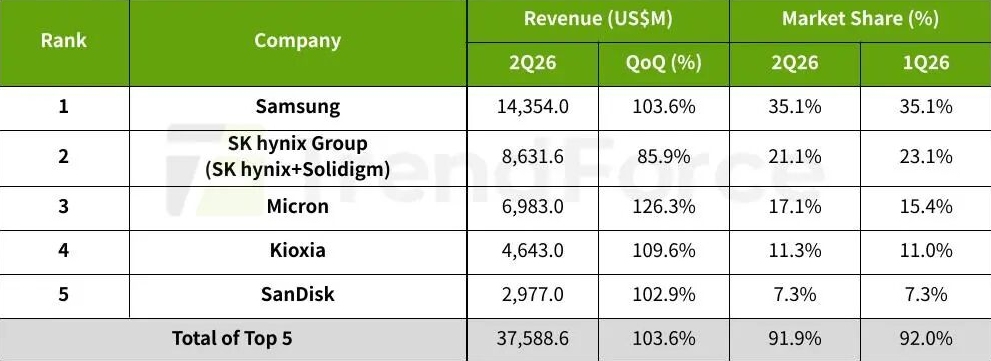
According to the latest memory industry research by TrendForce, combined revenue for the world's top five enterprise SSD brands in the second quarter of 2026 reached nearly $37.59 billion, representing a quarterly surge of 103.6%.
TrendForce-5edbde62335048a5a95a038d2daf42f2

Source: TrendForce

The research firm expects that in the third quarter, the growing popularity of generative AI agent services, steady deployment of data center infrastructure by cloud service providers (CSPs), and mass shipments of Nvidia's (NVDA) GB-series AI server cabinets will help keep enterprise SSD demand elevated, driving industry revenue to new heights.

In the second quarter, Micron's (MU) enterprise SSD revenue surged by 126.3% quarter-on-quarter to approximately $6.98 billion, achieving the highest growth rate among the top five suppliers. Following the AI boom, Micron has concentrated its production capacity on enterprise SSDs and HBM.

During the period, as SanDisk's high-capacity QLC enterprise SSDs entered a volume ramp phase that boosted quarterly bit shipments, its overall enterprise SSD revenue grew 102.9% quarter-on-quarter to nearly $2.98 billion.
5-ec6b299d7cdb4325a424e176b296fb20

SanDisk stock price chart, Source: TradingView

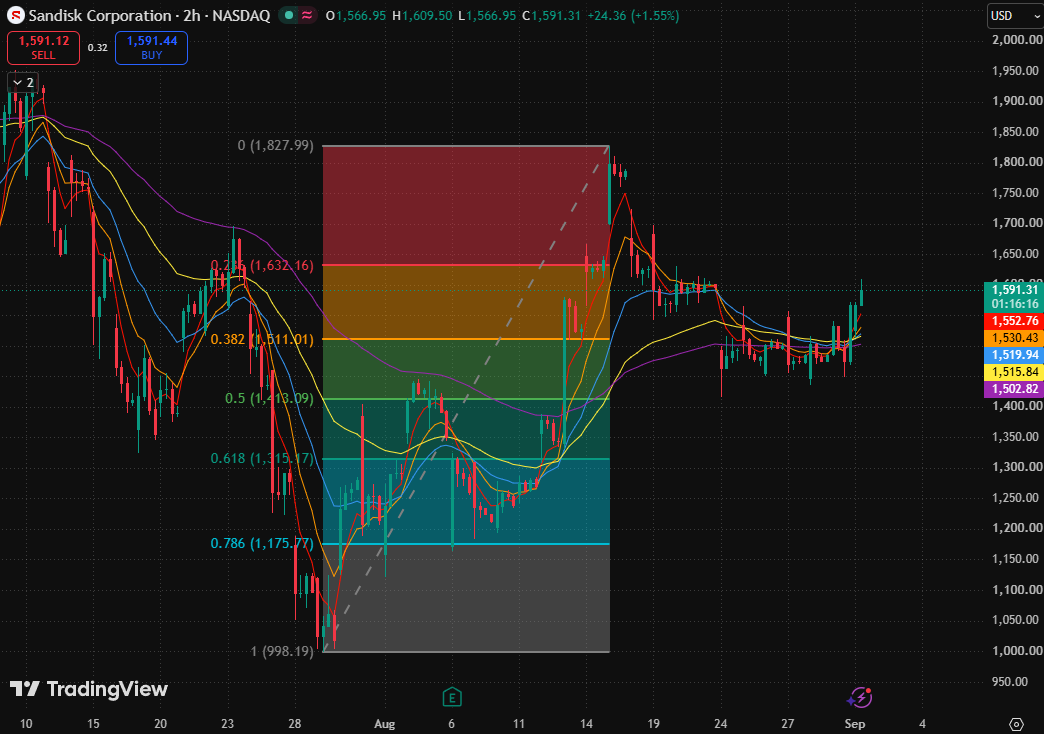
SanDisk's stock price has recently consolidated repeatedly in the $1,480–$1,550 range, and today it briefly broke out above its short-term consolidation zone. The stock has now reclaimed short-, medium-, and long-term moving averages including the 5-day, 10-day, and 20-day moving averages, and trades above the 0.382 Fibonacci retracement level ($1,511.01), showing a stronger short-term structure.

On the upside, the primary resistance level is the 0.236 Fibonacci retracement level ($1,632.16). A sustained move above this level could extend the rebound toward the key psychological mark of $1,700 and the period high of $1,827.99.

If the stock faces resistance at $1,632.16 and falls back below $1,553.12, it is more likely to re-enter a consolidation range between $1,511.01 and $1,632.16. A further loss of the 10-day and 20-day moving averages would significantly weaken short-term bullish momentum.

Disclaimer: For information purposes only. Past performance is not indicative of future results.
placeholder
Gold Price Analysis Today: Gold Rebounds After 1.91% Drop as Yields Ease. Is $4,449 Next? Gold fell about 1.91% on August 18 before producing a strong bullish reaction from the 1-hour demand zone in early August 19 trading. RSI is recovering from oversold conditions, but Supertrend remains bearish as traders await the Fed minutes.
Author  Naoufal Seddik
Aug 19, Wed
Gold fell about 1.91% on August 18 before producing a strong bullish reaction from the 1-hour demand zone in early August 19 trading. RSI is recovering from oversold conditions, but Supertrend remains bearish as traders await the Fed minutes.
placeholder
Gold Price Analysis Today: Gold Gains 0.94% as Markets Expect Fed to Hold Rates, Can $4,449 Resistance Break? Gold gained 0.94% on August 17, closing near $4,417.30 as softer US data strengthened expectations for unchanged Fed rates in September. Gold remains bullish, with $4,449.730 resistance and $4,310.650 support in focus.
Author  Naoufal Seddik
Aug 18, Tue
Gold gained 0.94% on August 17, closing near $4,417.30 as softer US data strengthened expectations for unchanged Fed rates in September. Gold remains bullish, with $4,449.730 resistance and $4,310.650 support in focus.
placeholder
Gold Price Analysis Today: Gold Drops 1.32% Despite Lower Fed Rate-Hike Bets, Can $4,313 Support Hold? Gold fell 1.32% on August 13 after rising to $4,449.73, then reversing lower and closing near $4,349.918 below the $4,356.46 support. Softer US inflation data reduced Fed rate hike expectations, but selling pressure still dominated the session. Will $4,313 support hold?
Author  Naoufal Seddik
Aug 14, Fri
Gold fell 1.32% on August 13 after rising to $4,449.73, then reversing lower and closing near $4,349.918 below the $4,356.46 support. Softer US inflation data reduced Fed rate hike expectations, but selling pressure still dominated the session. Will $4,313 support hold?
placeholder
XAUUSD Gold Analysis: Gold Holds Above $4,350 Ahead of US Inflation Data Is $4,500 Next? Gold holds above $4,350 following weak US jobs data. As inflation reports approach and UBS eyes $5,000, can XAUUSD break resistance at $4,435 to rally toward $4,500?
Author  Naoufal Seddik
Aug 12, Wed
Gold holds above $4,350 following weak US jobs data. As inflation reports approach and UBS eyes $5,000, can XAUUSD break resistance at $4,435 to rally toward $4,500?
placeholder
Intel Price Forecast: Nvidia Picked Xeon 6, Invested $5B, Yet Analysts Still Trail INTCIntel Corporation (NASDAQ: INTC) sits at $140.05, holding firm on the ascending trendline within the 2H timeframe. The RSI indicator is currently reading 55.21, positioning it as neutral-
Author  TradingKey
Jul 02, Thu
Intel Corporation (NASDAQ: INTC) sits at $140.05, holding firm on the ascending trendline within the 2H timeframe. The RSI indicator is currently reading 55.21, positioning it as neutral-
goTop
quote