

Micron Stock Price Forecast: Inverse Head-and-Shoulders Pattern Takes Shape, MU Stock Expected to Hit All-Time Highs

Source Tradingkey

TradingKey - As of August 31 Eastern Time, Micron (MU) stock rose 2.77% on the day to close at $958.73, reaching an intraday high of $959.78. After a rapid pullback from above $1,250 in late June, Micron's stock price has recently been consolidating mainly in the $800–$1,000 range. The stock is now approaching $1,000 again, showing signs of improvement in its short-term trend.

From a fundamental perspective, Micron remains supported by demand growth for HBM and DRAM driven by AI. In the latest quarter, revenue reached $41.46 billion, with an adjusted gross margin of 84.9%. The company expects next-quarter revenue of around $50 billion and a gross margin of about 86%. Meanwhile, HBM4 has entered volume shipments, and management stated that AI is driving rapid growth in data center memory and storage demand.
mu-ee8d8d19307c4ca9ae38596ff821359c

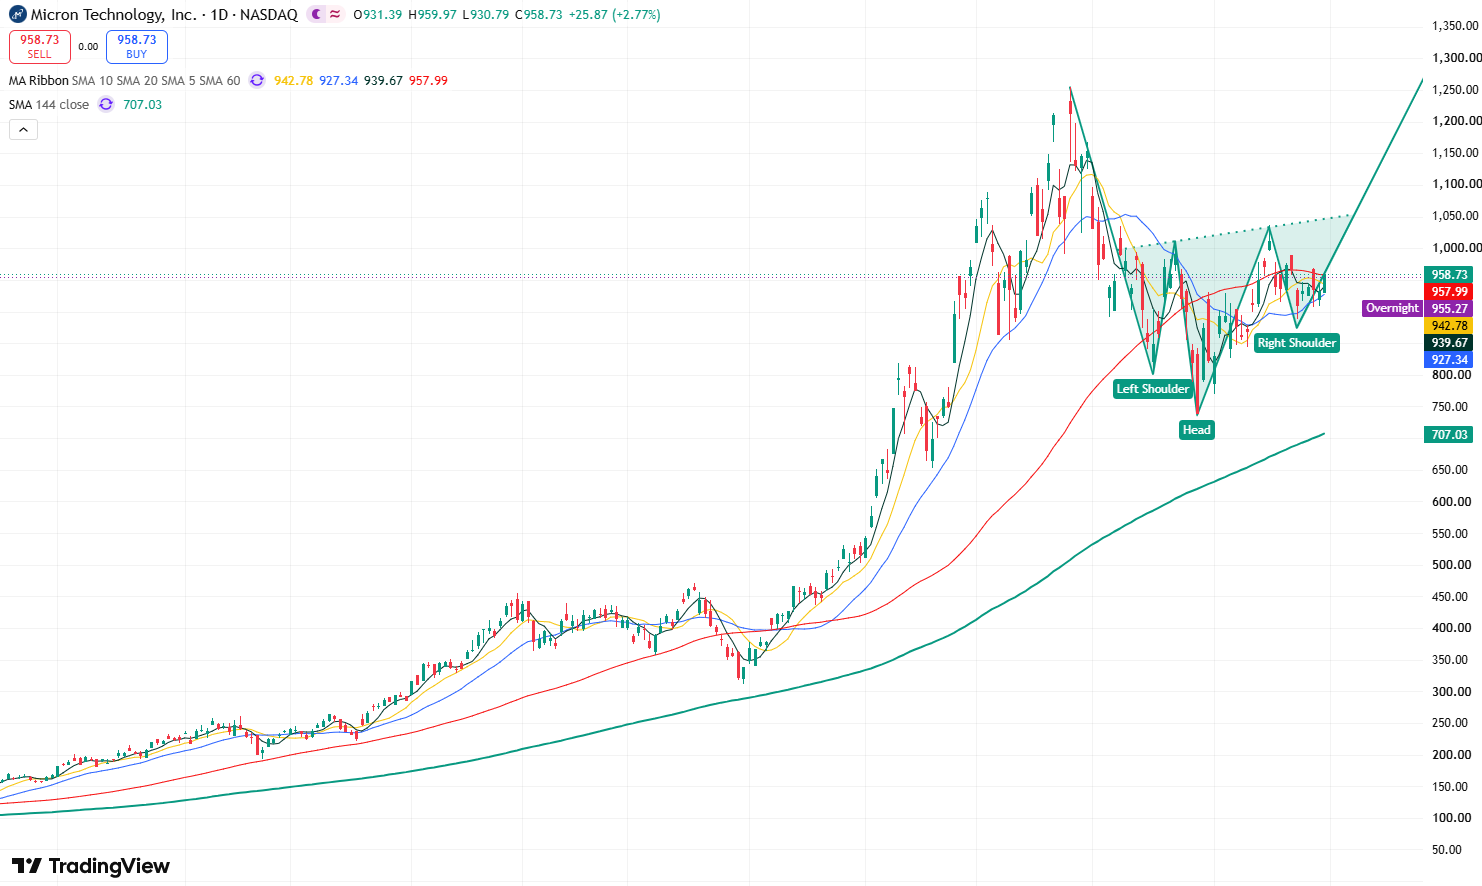
Micron stock daily chart, Source: TradingView

From the daily chart of Micron's stock price, after hitting an all-time high of $1,255 in June, the stock underwent a continuous pullback, dropping to a low of $737.88 before embarking on a sustained rebound. It subsequently formed a potential head-and-shoulders bottom structure, with the left shoulder at $804, the head at $737.88, and the right shoulder forming around $887.

Currently, the formation of the head-and-shoulders bottom structure suggests that short-term bullish momentum in the market will be significantly enhanced. The primary upside target for the stock will be to challenge the recent rebound high of $1,036.13. If it can break through and hold firmly above this level, it will open up upside room toward the previous all-time high of $1,255, and may even set a new record high.

On the downside, the primary support level to watch is near $887. If this level is lost, the stock may further probe down toward around $800. If the decline continues, the stock may test the support at the low of $737.88.

Disclaimer: For information purposes only. Past performance is not indicative of future results.
placeholder
XRP Price Prediction for July 2026: Can Buyers Finally Break the Downtrend?XRP (XRP) price trades near $1.05, caught between a year-long downtrend and a sudden burst of buying.July has historically rewarded XRP holders. This year the month arrives with on-chain accumulation
Author  Beincrypto
Jun 30, Tue
XRP (XRP) price trades near $1.05, caught between a year-long downtrend and a sudden burst of buying.July has historically rewarded XRP holders. This year the month arrives with on-chain accumulation
placeholder
What to Expect From Ethereum (ETH) in July 2026Ethereum (ETH) enters July 2026 trading near $1,570, close to multi-month lows, after recording its first run of three consecutive red quarterly candles in its history.On-chain data and price charts n
Author  Beincrypto
Jul 01, Wed
Ethereum (ETH) enters July 2026 trading near $1,570, close to multi-month lows, after recording its first run of three consecutive red quarterly candles in its history.On-chain data and price charts n
placeholder
XAUUSD Gold Analysis: Gold Holds Above $4,350 Ahead of US Inflation Data Is $4,500 Next? Gold holds above $4,350 following weak US jobs data. As inflation reports approach and UBS eyes $5,000, can XAUUSD break resistance at $4,435 to rally toward $4,500?
Author  Naoufal Seddik
Aug 12, Wed
Gold holds above $4,350 following weak US jobs data. As inflation reports approach and UBS eyes $5,000, can XAUUSD break resistance at $4,435 to rally toward $4,500?
placeholder
Gold Price Analysis Today: Gold Gains 0.94% as Markets Expect Fed to Hold Rates, Can $4,449 Resistance Break? Gold gained 0.94% on August 17, closing near $4,417.30 as softer US data strengthened expectations for unchanged Fed rates in September. Gold remains bullish, with $4,449.730 resistance and $4,310.650 support in focus.
Author  Naoufal Seddik
Aug 18, Tue
Gold gained 0.94% on August 17, closing near $4,417.30 as softer US data strengthened expectations for unchanged Fed rates in September. Gold remains bullish, with $4,449.730 resistance and $4,310.650 support in focus.
placeholder
Gold Price Analysis Today: Gold Rebounds After 1.91% Drop as Yields Ease. Is $4,449 Next? Gold fell about 1.91% on August 18 before producing a strong bullish reaction from the 1-hour demand zone in early August 19 trading. RSI is recovering from oversold conditions, but Supertrend remains bearish as traders await the Fed minutes.
Author  Naoufal Seddik
Aug 19, Wed
Gold fell about 1.91% on August 18 before producing a strong bullish reaction from the 1-hour demand zone in early August 19 trading. RSI is recovering from oversold conditions, but Supertrend remains bearish as traders await the Fed minutes.
goTop
quote