


If a Bear Market Is Coming, History Has Good News for Investors
Key Points
It’s a matter of when -- not if -- the next bear market will begin.
But here’s the good news: bear markets are much shorter than bull markets.
- 10 stocks we like better than S&P 500 Index ›
There have been 12 official bull markets since the end of World War II, with an average length of five and a half years. The current bull market, which started on Oct. 12, 2022, is nearly four years old. The S&P 500 (SNPINDEX: ^GSPC) has delivered a total return of 128% during that bull run, but it looks historically expensive at 30 times its trailing 12-month earnings.
Therefore, it's only a matter of time before the next bear market begins. More than a dozen bear markets have occurred over the past eight decades, with an average peak-to-trough decline of 32%. But here's the good news: bear markets tend to be much shorter than bull markets.
Missed Nvidia in 2009? This Rare Signal Is Flashing Again. In 2009, a "Double Down" signal flashed for a little-known chipmaker called Nvidia. For the first time in years, that same "Total Conviction" signal is flashing for a company 1/100th the size of Nvidia. Continue »
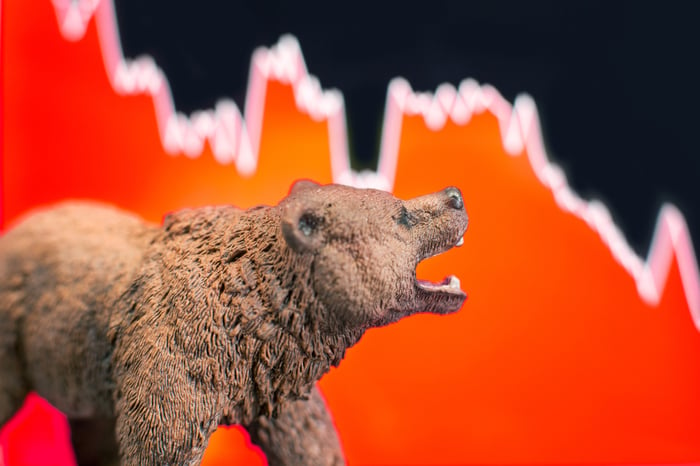
Image source: Getty Images.
Why are bear markets shorter than bull markets?
Since the end of World War II, the average bear market has only lasted for 1.2 years. That means the stock market spends about 78% of its time expanding rather than contracting. Bear markets are much shorter than bull markets for three reasons.
First, the selling cycle is driven by panic, and stocks drop much faster than they rise. That fear spreads rapidly and drives more investors to liquidate their positions. Those liquidations can cascade as margin calls, stop-loss orders, and other cutoffs are triggered. Highly leveraged investors will be forced to sell their positions immediately.
Second, severe market crashes can drive the government to respond with monetary easing, interest rate cuts, liquidity injections, and stimulus packages. Those measures can stop the bleeding and draw more investors back to the market.
Lastly, America's stock market is a mirror of its growing economy. As long as America's top companies continue to expand -- supported by population growth, innovation, and improved productivity -- its top stocks will rise over the long term.
Why is that good news for investors?
When the next bear market happens, it will be tempting to liquidate your stocks and park your cash in CDs, T-bills, or other low-risk, high-yielding investments. But by doing so, you'll miss out on some massive long-term gains. A $1,000 investment in the S&P 500 on the first day of 2006, with reinvested dividends, would be worth about $6,200 today -- even after weathering the Great Recession, the COVID-19 crash, and the rate hike shocks of 2022 and 2023. That same investment in a 20-Year Treasury, with reinvested yields, would only have grown to $1,500.
Therefore, the lesson is simple. Bear markets are shorter than bull markets, and they're usually a great time to buy more stocks rather than blindly sell them. As Warren Buffett famously told investors, you should only be "greedy when others are fearful."
Should you buy stock in S&P 500 Index right now?
Before you buy stock in S&P 500 Index, consider this:
The Motley Fool Stock Advisor analyst team just identified what they believe are the 10 best stocks for investors to buy now… and S&P 500 Index wasn’t one of them. The 10 stocks that made the cut could produce monster returns in the coming years.
Consider when Netflix made this list on December 17, 2004... if you invested $1,000 at the time of our recommendation, you’d have $430,571!* Or when Nvidia made this list on April 15, 2005... if you invested $1,000 at the time of our recommendation, you’d have $1,399,268!*
Now, it’s worth noting Stock Advisor’s total average return is 986% — a market-crushing outperformance compared to 214% for the S&P 500. Don't miss the latest top 10 list, available with Stock Advisor, and join an investing community built by individual investors for individual investors.
See the 10 stocks »
*Stock Advisor returns as of August 29, 2026.
Leo Sun has no position in any of the stocks mentioned. The Motley Fool has no position in any of the stocks mentioned. The Motley Fool has a disclosure policy.
Recommended Articles


