


If You Invest $1,000 in VOO Right Now and Never Touch It, Here's What History Says You Could Have in 25 Years
Key Points
Investors can't buy directly into a stock market index.
Exchange-traded funds like the Vanguard S&P 500 ETF or the SPDR S&P 500 ETF Trust, however, effectively make it possible to do so.
The S&P 500's average annual performance's persistence speaks volumes about its repeatability.
- 10 stocks we like better than Vanguard S&P 500 ETF ›
As the clichéd saying goes, past performance is no guarantee of future results. It is a pretty good indication of what's likely, though, if the underpinnings of that performance don't change.
To this end, assuming the stock market's long-term history repeats itself, what would, say, a $1,000 investment in the S&P 500 (SNPINDEX: ^GSPC) made today be worth 25 years from now?
Missed Nvidia in 2009? This Rare Signal Is Flashing Again. In 2009, a "Double Down" signal flashed for a little-known chipmaker called Nvidia. For the first time in years, that same "Total Conviction" signal is flashing for a company 1/100th the size of Nvidia. Continue »
It's not too tough to figure out.

Image source: Getty Images.
Crunching the numbers
You can't invest in the S&P 500 index itself. But, you can buy an index fund like the Vanguard S&P 500 ETF (NYSEMKT: VOO) or the SPDR S&P 500 ETF Trust (NYSEMKT: SPY) meant to mirror it. They both do a good job of matching the index's performance, too.
History says its performance is plenty promising. A $1,000 investment made in the S&P 500 exactly 25 years ago would be worth $6,604 today. And that's not counting any dividend payments made in the meantime. Had you reinvested the index's or ETFs' dividends dished out between then and now, your position would be worth $10,540 today.
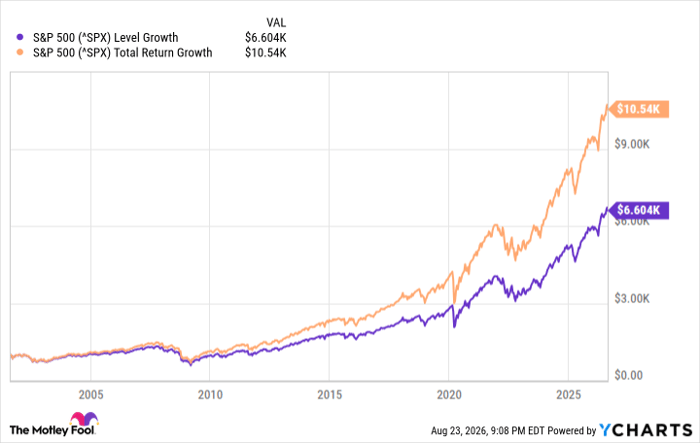
^SPX data by YCharts
Assuming history repeats itself and the S&P 500 maintains its average net annual gain of nearly 10%, putting the same amount of money to work in the same investment could achieve roughly the same result, growing it to around $10,540 by late-August 2051.
A well-established growth rate for this economic backdrop
Again, past performance is no guarantee of future results. It's possible the next 25 years won't be as fruitful for stocks as the past 25 have been.
It's possible, but seemingly unlikely. Not only has the market averaged an annual return of nearly 10% for the past 25 years, but that's the average yearly net gain going all the way back to 1928. That long-term growth rate is too persistently consistent to pretend there's nothing to it. Assuming that backdrop doesn't change, look for this average yearly gain to repeat itself.
Just be prepared to hold through the inevitable ups and downs in shorter-term time frames.
Should you buy stock in Vanguard S&P 500 ETF right now?
Before you buy stock in Vanguard S&P 500 ETF, consider this:
The Motley Fool Stock Advisor analyst team just identified what they believe are the 10 best stocks for investors to buy now… and Vanguard S&P 500 ETF wasn’t one of them. The 10 stocks that made the cut could produce monster returns in the coming years.
Consider when Netflix made this list on December 17, 2004... if you invested $1,000 at the time of our recommendation, you’d have $443,461!* Or when Nvidia made this list on April 15, 2005... if you invested $1,000 at the time of our recommendation, you’d have $1,307,633!*
Now, it’s worth noting Stock Advisor’s total average return is 973% — a market-crushing outperformance compared to 213% for the S&P 500. Don't miss the latest top 10 list, available with Stock Advisor, and join an investing community built by individual investors for individual investors.
See the 10 stocks »
*Stock Advisor returns as of August 26, 2026.
James Brumley has no position in any of the stocks mentioned. The Motley Fool has positions in and recommends Vanguard S&P 500 ETF. The Motley Fool has a disclosure policy.
Recommended Articles


