


Here's Why the Smartest Investors Keep Coming Back to This Simple Stock Market Strategy
Key Points
Index-based ETFs provide investors with instant portfolio diversification.
The index managers use specific criteria to weed out weak performers.
The S&P 500 has delivered extraordinary gains over the past 20 years.
- 10 stocks we like better than Vanguard S&P 500 ETF ›
One of the biggest mistakes new investors make is buying overvalued stocks. In strong bull markets, like now, investors see prices going up and join for the ride. Today, investors are excited about advances in artificial intelligence (AI), and many top AI stocks are priced at high valuations.
More seasoned investors know that once a stock becomes well-known and hyped up, it has often reached a peak, and that's the worst time to buy it.
Missed Nvidia in 2009? This Rare Signal Is Flashing Again. In 2009, a "Double Down" signal flashed for a little-known chipmaker called Nvidia. For the first time in years, that same "Total Conviction" signal is flashing for a company 1/100th the size of Nvidia. Continue »
One great example from this year is Sandisk, which reached a peak of $2,335 in June, a 6,390% year-to-date increase, as memory became AI's hottest commodity. However, it also reached a P/E ratio of 81 at that time, and the stock is down 17% since then.

Image source: Getty Images.
The problem for any investor is that no one knows the future, and top stocks can quickly plummet on bad news, negative market sentiment, or for many other reasons. It can become cumbersome and anxiety-provoking to manage a portfolio of hot stocks.
There are various methods for dealing with this, including deliberate diversification and dollar-cost averaging. But the one that the smartest investors keep coming back to is investing in exchange-traded funds (ETF) that track an index.
Why ETFs make the most sense
ETFs take the guesswork out of investing for the amateur investor, and the stock-picking method ensures that top stocks remain in the index. If you're not sure about whether a stock has reached a peak or if you're getting a good value, the ETF process accounts for that.
The most popular ETF in the world is the Vanguard S&P 500 ETF (NYSEMKT: VOO), which has $1.7 trillion in assets under management. As the name implies, it tracks the S&P 500. While the S&P 500 is often used as a proxy for the market, it has specific criteria for which stocks make the cut. They're large-cap stocks that have had to achieve profitability, implying that only top stocks, which have both grown large enough to meet the threshold and are operating efficiently enough to turn a profit, will be included. It also has healthy diversification with 500 stocks, creating an instant portfolio.
Warren Buffett explained it like this: "The trick is not to pick the right company, the trick is to essentially buy all the big companies through the S&P 500 and to do it consistently and to do it in a very, very low-cost way." The Vanguard ETF has some of the lowest costs, with an expense ratio of 0.03%, allowing you to keep more of the gains.
But the proof is in the performance. The S&P 500 has returned an average 11.4% annualized over the past 20 years, and it's very hard to beat it.
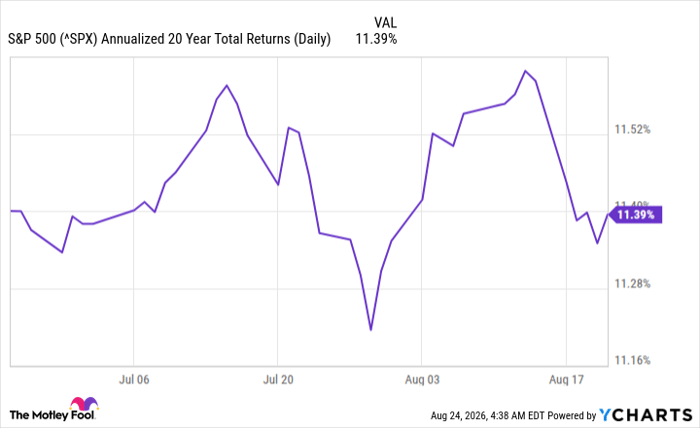
^SPX data by YCharts
There are other ETFs you also might want to consider that offer a similar strategy, like the Vanguard S&P 500 Growth ETF (NYSEMKT: VOOG), the Schwab U.S. Dividend Equity ETF (NYSEMKT: SCHD), and the simple ETF investing strategy in its various forms offers great value for investors.
Should you buy stock in Vanguard S&P 500 ETF right now?
Before you buy stock in Vanguard S&P 500 ETF, consider this:
The Motley Fool Stock Advisor analyst team just identified what they believe are the 10 best stocks for investors to buy now… and Vanguard S&P 500 ETF wasn’t one of them. The 10 stocks that made the cut could produce monster returns in the coming years.
Consider when Netflix made this list on December 17, 2004... if you invested $1,000 at the time of our recommendation, you’d have $443,461!* Or when Nvidia made this list on April 15, 2005... if you invested $1,000 at the time of our recommendation, you’d have $1,307,633!*
Now, it’s worth noting Stock Advisor’s total average return is 973% — a market-crushing outperformance compared to 213% for the S&P 500. Don't miss the latest top 10 list, available with Stock Advisor, and join an investing community built by individual investors for individual investors.
See the 10 stocks »
*Stock Advisor returns as of August 26, 2026.
Jennifer Saibil has positions in Vanguard Admiral Funds-Vanguard S&P 500 Growth ETF and Vanguard S&P 500 ETF. The Motley Fool has positions in and recommends Vanguard S&P 500 ETF. The Motley Fool has a disclosure policy.
Recommended Articles


