


Why Walmart Stock Plunged 9% After Earnings Beat Revenue Expectations?
TradingKey - Walmart (WMT) delivered a second-quarter earnings report that appeared strong on the surface, but harbored clear underlying concerns.
Both the company's revenue and adjusted earnings per share exceeded market expectations, and its full-year sales and operating profit outlook was also raised. However, U.S. same-store sales growth slowed to its lowest level in over six years, and third-quarter earnings guidance also missed expectations, raising concerns among investors that its growth momentum is slowing.
Following the earnings release, Walmart's stock fell by as much as about 10% at one point before closing down 9.15% at $103.84, marking its largest single-day drop since May 2022 and wiping out over $80 billion in market value.
Walmart Second-Quarter Revenue and Profit Both Beat Expectations
For the second quarter of fiscal 2027 ended July 31, 2026, Walmart's total revenue increased 5.9% year-over-year to $187.937 billion, beating market expectations of $186.87 billion; adjusted earnings per share came in at $0.81, also topping analysts' estimates of $0.74.
The company's operating income reached $9.383 billion, up 28.8% year-over-year, while gross margin expanded 0.96 percentage points year-over-year to 25.4%. Net sales for Walmart U.S. grew 3.5% to $125.2 billion, with operating income rising 20.6% to $8.1 billion. Global e-commerce sales grew 23% year-over-year, driven by a 24% increase in U.S. e-commerce sales, continuing to serve as a key revenue driver.
The strong quarterly performance also prompted Walmart to raise its full-year outlook. The company now expects net sales for fiscal 2027 to grow 4% to 5%, up from its previous forecast of 3.5% to 4.5%; adjusted operating income is projected to increase 7% to 8.5%, compared with the prior guidance of 6% to 8%.
Despite beating expectations on multiple metrics, the market did not raise Walmart's valuation, choosing instead to focus on issues such as slowing growth in its core U.S. business, pressure on consumer spending, and a potential squeeze on future profit margins.
Why US Same-Store Sales Have Become the Biggest Concern?
In the second quarter, Walmart U.S. same-store sales grew by just 2.6% excluding fuel, falling short of Wall Street expectations of 3.7% to 3.8% and marking the slowest quarterly growth rate since 2020. This metric slowed for the second consecutive quarter, becoming the most disappointing figure for investors in this earnings report.
The pharmacy business was one of the main drags, as federal drug pricing policies weighed on revenue from certain prescription drugs, while the growth momentum driven by GLP-1 therapies over the past two years also began to fade.
Meanwhile, foot traffic growth at Walmart U.S. stores slowed to 1.5%, and the average ticket size grew by only 1.1%, significantly below the 3.1% recorded in the same period last year. Consumers are still shopping, but they are paying closer attention to prices and scaling back on certain discretionary spending.
High fuel prices further squeezed household budgets. Walmart Chief Financial Officer John David Rainey stated that when gasoline prices rise above $4 per gallon, consumers experience a noticeable psychological impact and make more trade-offs among various everyday essentials. The company currently expects fuel costs to increase by approximately $2 billion more than previously projected, which not only affects customer purchasing power but also drives up Walmart's own logistics and distribution expenses.
As the largest retailer in the United States, Walmart has long been viewed as a key window into the consumer environment. Same-store sales growth falling to a six-year low signals that even Walmart, with its low-price advantage, is beginning to feel the pressure of slowing consumer spending.
Price-Cut Spending and Third-Quarter Guidance Fuel Profit Concerns
To attract price-conscious consumers, Walmart plans to use approximately $2.9 billion in tariff refunds to cut prices on about 11,000 items, including beef, beverages, snacks, and general merchandise. The company hopes to trade some short-term profit for higher sales volume and further expand its market share.
However, this tariff refund is a one-time gain, whereas the profit pressure from price cuts could last longer. Although price reductions help boost customer traffic, Walmart's profitability over the next few quarters could be impacted if volume growth is insufficient to offset the decline in gross margin.
Meanwhile, third-quarter guidance provided by management further compounded these concerns. Walmart expects Q3 net sales to grow by 3% to 3.75%, below Wall Street's forecast of 4.8%; adjusted earnings per share are expected to be $0.62 to $0.64, also missing analysts' estimates of $0.68.
As the third quarter covers the back-to-school season and the ramp-up for the year-end holiday shopping period, its performance is particularly crucial to full-year results. The weaker guidance suggests that the price cuts made in the second quarter, along with rising fuel costs, could continue to weigh on short-term profits.
Although Walmart raised its full-year adjusted EPS guidance from $2.75–$2.85 to $2.80–$2.87, it still fell short of market expectations of around $2.90.
Walmart Stock Technical Analysis: Will WMT Continue to Fall After the Plunge?
Source: TradingView
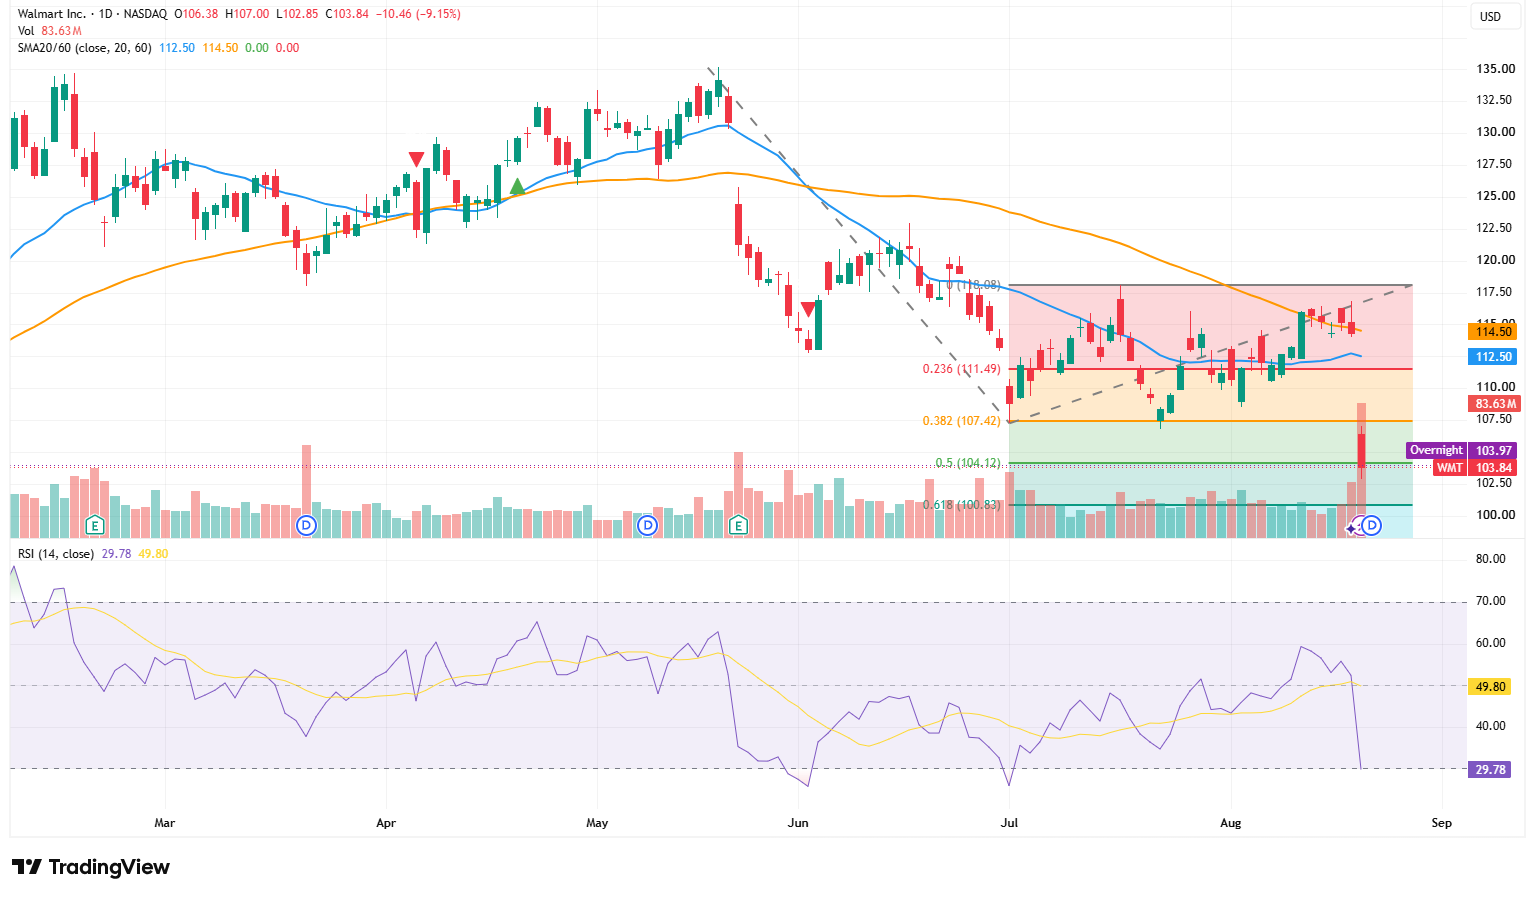
Looking at the daily chart, Walmart shares fell 9.15% in a single day to close at $103.84, accompanied by a significant surge in trading volume. This indicates strong capital sell-off characteristics rather than a routine low-volume pullback. The stock not only broke below its recent upward trendline but also lost its 20-day moving average at $112.50 and 60-day moving average at $114.50, shifting the short-term trend back to bearish.
Fibonacci extensions show that the stock price has fallen below the 0.5 level at $104.12, with the next major support near $100.83, while $100 also acts as a strong key psychological level. If this region holds, the stock may see a technical rebound from oversold conditions. However, if it subsequently breaks below $100.83 on heavy volume, the downside target could shift further to $96.14, with a potential slide toward the $90 to $92 range in an extreme scenario.
In terms of momentum, the 14-day RSI has fallen to 29.78, entering traditional oversold territory. This suggests that the risk of chasing short positions in the short term is increasing, and the stock could see an oversold rebound at any time. However, an RSI falling below 30 does not mean a bottom has been reached. The indicator remains significantly below its moving average of 49.80, without yet forming a bullish divergence or confirming a reversal by crossing back above 30. Therefore, any rebound should currently be viewed only as a weak recovery.
To the upside, focus first on the $104.12 to $107.42 zone. Only by reclaiming $107.42 can the stock initially relieve breakdown pressure. Further resistance sits at $111.49, while the $112.50 to $114.50 range formed by the 20-day and 60-day moving averages serves as a more critical overhead resistance band. Only a high-volume recovery above this zone would give the short-term trend a chance to regain strength.
Recommended Articles


