


Amazon Q2 Smashes Estimates: $200.6B Revenue, EPS $5.75 Beat, AWS +37%, $220B Capex, $3T Market Cap
TradingKey - Amazon (AMZN) released Q2 results on July 30, beating all estimates and sending stock to new peaks with a double digit after hours surge. Analysts anticipated $196B in revenue, and sales clocked in at $200.6B, up 20% YoY. Impressively, Amazon beat on expectations for EPS, with $5.75 vs. consensus at $1.81. AWS was the star of the show reporting $42.2B, up 37% YoY, its fastest quarterly growth in 18 quarters — back to approximately Q4 2021. In this growth environment, management altered their 2026 forecast range to $220B (from $200B), with the majority of the new spend pushed toward new AI data center infrastructure.
The stock has traded as high as $287.20 since the report. However, during the conference call, Amazon noted negative free cash flow at -$7.6B, reflecting the cash needed to fund the company's growth. Currently, AMZN is consolidating around $265, and direction heading into $272-273 resistance depends on whether the company can exceed current highs. Jackson Hole Fed Conference is the next catalyst to impact whether investors believe in high spending AI strategies.
Q2 Revenue $200.6B (+20%): EPS Crush with $5.75 Beat vs $1.81 Est
Amazon has a reported Q2 revenue of $200.6 billion that shows a 20% increase from last year and beats the analysts' expected value of ~$196 billion. North America segment sales increased 16% year-over-year to $116.2 billion, International segment sales increased 15% to $42.2 billion, and AWS — also reporting $42.2 billion — grew 37%, making it the clear standout of the three.
Operating income have also increased by 43% this reporting period and now stand at $27.5 billion, and the operating margin also increased to 13.7% from last year's reported value of 11.4%. All of this occurred while the company continued a high level of investments.
Above all else, Amazon reported a $5.75 diluted EPS that massively beats the $1.81 estimate. The GAAP EPS of $5.75 was heavily inflated by a $53.4 billion non-operating, non-cash accounting gain from Amazon's Anthropic investment — a mark-to-market revaluation, not an operational result. Excluding this gain, adjusted EPS was approximately $1.97. Amazon has actually beaten its guideline expectation of revenue and EPS. This is a rare occurrence for such a large and influential tech company.
AWS Reacceleration: +37% Growth, Fastest in 18 Quarters
At 37% year-over-year growth, AWS revenue hit $42.2 billion, the strongest quarterly growth in over four years. The reacceleration became even more critical considering recent quarterly slowdowns from major competitors like Microsoft Azure (43% year-over-year growth in Microsoft's FQ4) and Google Cloud (82% year-over-year growth).
Indicators show AWS is effectively capturing the demand for generative-AI and agentic-AI workloads from Amazon's enterprise customers. Demand is so great, that AWS may sell out on their 2026 commitments. CEO Andy Jassy mentioned on the earnings call that they are taking a $220B capex commitment, and even with that, the available capacity will fulfill 2026 demand. Jassy was not afraid to mention a bright future, saying demand for 2028 capacity is already 'striking', and looking for a need 4 years into the future still speaks volumes on the sustainability of demand looking forward.
Capex Plan Raised to $220B: $20B Increase Reflects Demand Confidence
Seemingly right after showing an impressive jump in AWS growth, Amazon made a subtle announcement moving their expected full-year 2026 capital-expenditures from $200B to $220B. With $220B representing roughly 11% of Amazon's trailing twelve months sales, this makes for one of the larger capex programs in the industry. For Amazon, this is effectively a bet on thedemand for AWS and AI Infrastructure exceeding capital spending in the For years to come, allowing for positive returns on invested capital.
Free Cash Flow Turned Negative: $7.6B Cash Burn (TTM)
At around negative $7.6 billion, Amazon’s trailing 12-month free cash flow was in the negative. This is not a signal of operational impairment as Amazon’s operating cash flow is very much intact. This negative free cash flow is more a testament to the nature and scale of the company’s capital deployment. Operating cash flow grew 33% to $161.4 billion on a trailing twelve-month basis, even as operating expenses rose approximately 18% year-over-year, driven by AI infrastructure buildout, R&D, and stock-based compensation for generative AI hiring and retention.
Management thinks negatively impacted free cash flow will be temporary, but positively impacted free cash flow will persist. If AWS and artificial intelligence (AI) services continue to accelerate and give way to positive operating cash flow that exceeds capital spending, then fast positive free cash flow will return to the company by 2027. Conversely, if AI demand does not generate profit or the company struggles to recoup the cost of deployment, then FCF will remain negative mounting a continued pressure on valuation multiples.
Advertising Revenue +26% to $19.8B: Second High-Margin Engine
Amazon's ad business continues to grow as a high-margin growth engine. Advertising brought in $19.8 billion, up 26% from the previous year, and now contributes about 10% of Amazon's overall revenue. Amazon's advantage is its purchase-intent data from its huge marketplace. Advertisers can use purchase intent data rather than depend on targeting based on demographics or behavior.
Advertising also enables Amazon to monetize traffic without incurring the overhead from fulfillment or inventory for retail. In a few years as advertising grows to 15-20% of revenue, it will improve profitability margins.
Regulatory Headwinds: NJ Antitrust Suit, Bezos $4B Stock Sale
Despite strong earnings, Amazon had negative press in early August when the Attorney General of New Jersey filed an antitrust lawsuit against Amazon. On August 3, founder Bezos filed to sell approximately 15 million shares worth about $4.07 billion through a Rule 10b5-1 pre-scheduled trading plan adopted on November 14, 2025 — meaning the timing was set months in advance and reflects routine diversification, not a real-time view on valuation.
The filing doesn't impact the earnings, but antitrust suits are a growing concern as other states and countries follow New Jersey in bringing suits. Regulatory pressure has not forced Amazon to make large changes to its business.
$3 Trillion Market Cap Milestone: AWS Path to $1 Trillion Revenue
August 3 marked the first time in history Amazon hit a market cap of $3 trillion. Exactly two weeks later, Morgan Stanley published research stating that AWS could hit a trillion dollar run rate in 8-10 years. This projection would be made possible from AI Infrastructure, Cloud Computing, Data Analytics, and Enterprise AI.
The current AWS annualized revenue run rate stands at $169 billion, with quarterly revenue of $42.2 billion. If AWS is able to actualize this research, it would make AWS one of the largest software businesses in the world.
AMZN Technical Setup: $265 Consolidating, $272-273 Resistance Critical for $287+ Retest
After pulling back from its $287.20 all-time high, AMZN is currently consolidating around $265. The first immediate level of technical resistance for AMZN is the $272.87-$272.94 zone, formed by the combination of horizontal resistance and the 23.6% Fibonacci retracement. A break of $273 would be constructive to the recovery structure and potentially re-expose the $287.33 high.
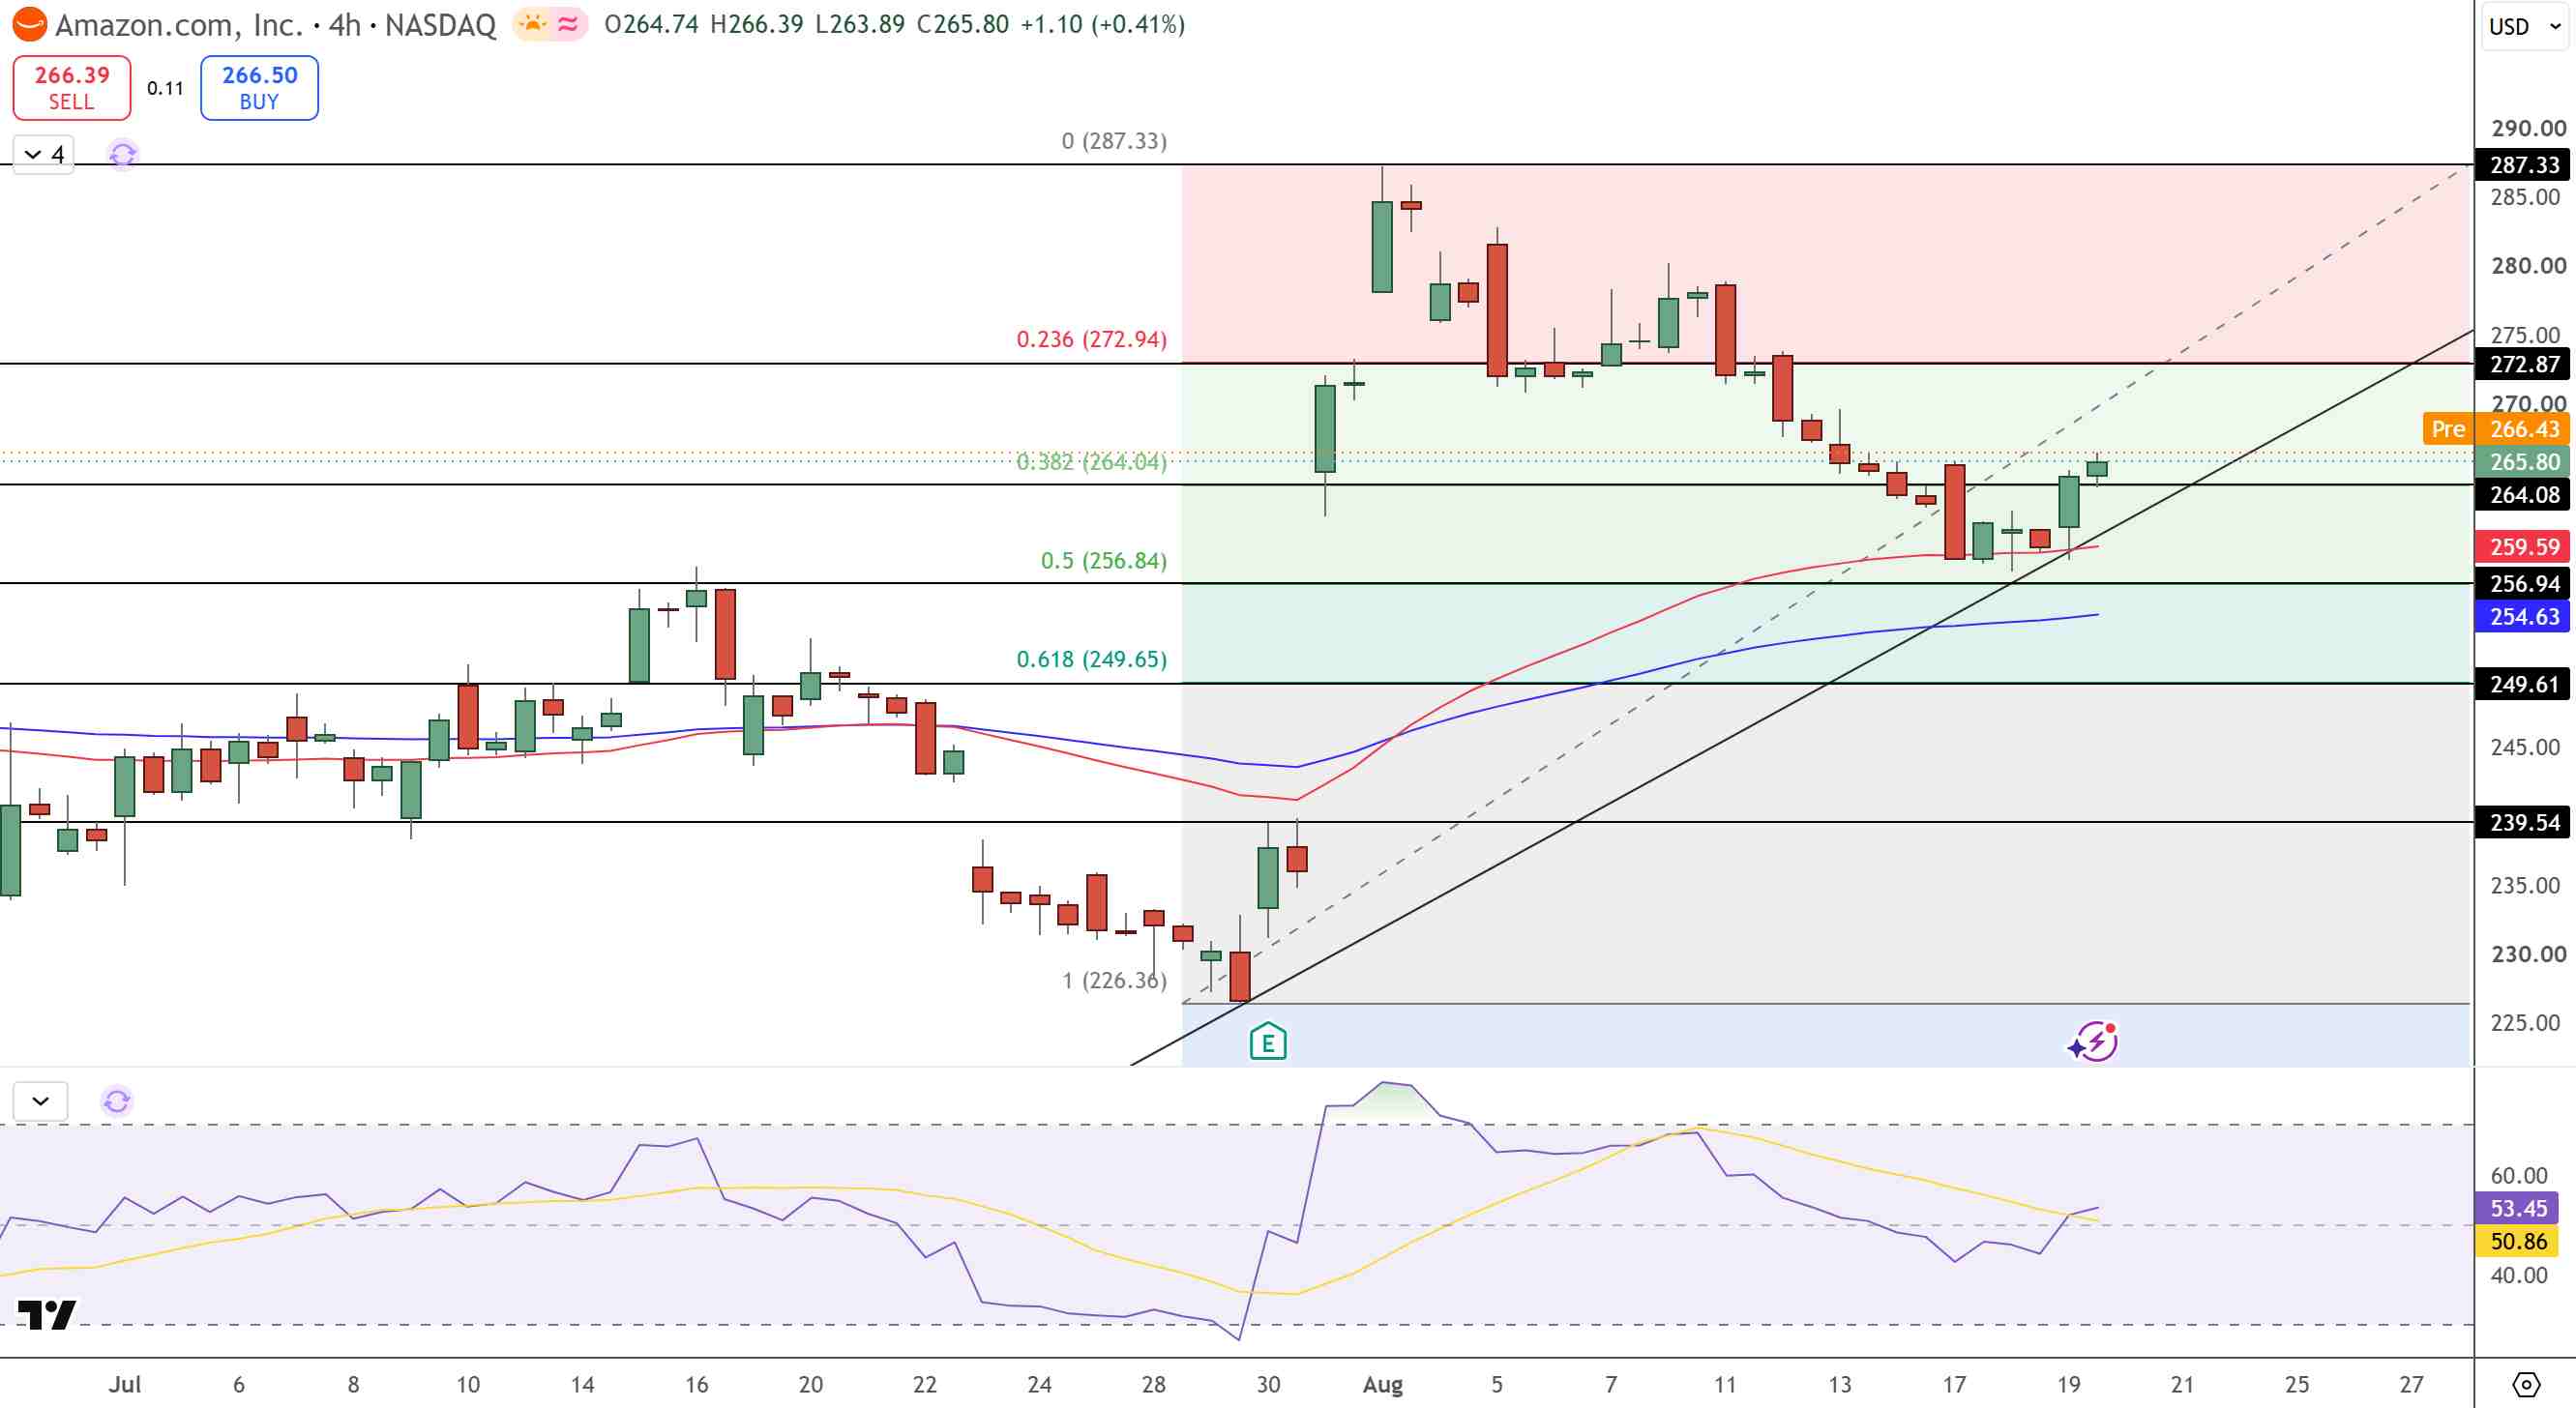
Bitcoin Price Chart - Source: Tradingview
In the event AMZN pulls back, the first support zone is expected to be at $256.84-$259.59. Below that is the longer moving average at $254.63. Currently, RSI is recovering, but is well below the 70 overbought level, suggesting that there is buying interest, but not to the point where the stock is overbought.
Key Technical Levels (Into Jackson Hole & Beyond)
- Immediate resistance: $272.87-$272.94 (23.6% Fibonacci)
- Breakout target: $287.33 (recent high, all-time high $287.20)
- First support: $259.59-$256.84
- Longer MA support: $254.63
- Breakdown level: $249.65 (61.8% Fibonacci retracement)
- 52-week range: $196.00 - $287.20
Bottom Line (Aug 20, 3 Weeks After Q2 Earnings)
With Capex at $220B, Amazon reported a 20% increase in revenue (beating estimates at $200.6B), and a massive EPS beat with a reported number of $5.75, above the estimated number of $1.81. AWS recorded a 37% increase in revenue at $42.2B. Advertising revenue increased by 26% to $19.8B. Amazon is facing a high level of regulatory risk due to the NJ antitrust lawsuit.
AMZN closed at $265.84 after its consolidation from its Aug 3 all-time high of $287.20..$272-$273 will be the next area of resistance. A break over $273 will target $287. Support is expected to be $256-$259. RSI at 53 is suggesting a constructive level of bullishness. From a relative perspective, AMZN is trading at a 35% premium from its $196 lows.
For investors: Amazon demonstrated how it can grow revenue 20%, increase operating margins to 13.7%, and realize 37% growth in AWS while dealing with sizable capital expenditures and cash burn. The bull case says: The demand for AWS and AI infrastructure, speed of capex, improving returns on advertising, and advertising growing to 15%+ of revenue, are all growth areas. The bear case says: Regulations are increasing, returns on capex are poor, demand for AI is slowing. The near-term case suggests a possible $272-273 technical break to confirm a $287-300 retest. Jackson Hole meeting (Aug 27–29) will give us insight into the upcoming Fed policy. October is the estimated time for next earnings. This is not investment advice, and just a breakdown of the data.
Recommended Articles


